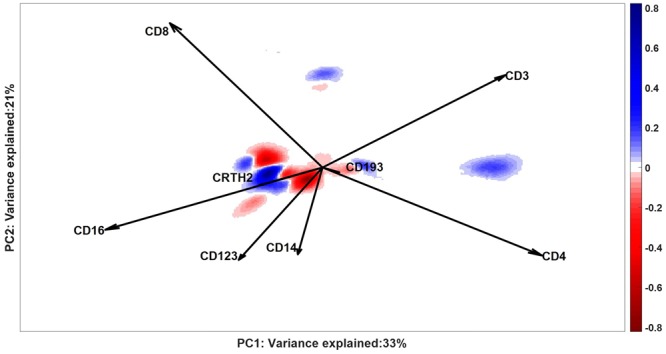
Figure 7.

Density plot of Difference between Densities: the negative intensity (red) shows the locations where a larger fraction of cells scores for patients than for control individuals; positive intensities (blue) contain cells with larger fractions of normal cells. White areas either contain no cells or have similar fractions in both groups of individuals. The axes report the variance explained by the SCA Control Model for the control individuals, on which the DbD is calculated. Loadings of the SCA Control Model are represented as vectors: loadings with similar directions indicate positive co-expression (like for CD16, CRTH2 and CD193, CD4) and with opposite directions indicate negative (like for CD3 and CD16) co-expression of both surface markers. Orthogonal vectors indicate surface markers that express independently, e.g.CD8 and CD123.
