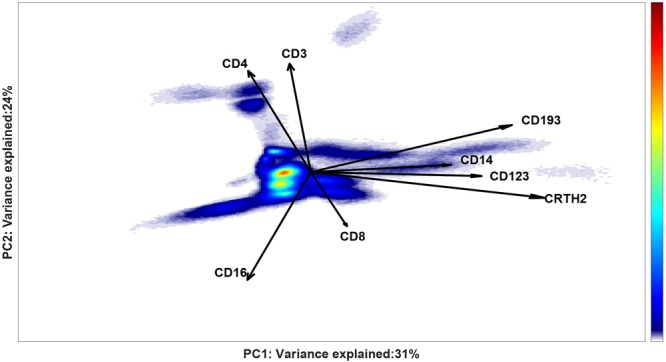
Figure 8.

General ECLIPSE model built on all non-normal cells of the 11 asthma patients. A density estimation of the cell scores distribution is shown, where density is quantified from low (blue) to high intensity (red). Multiple cell sub-populations with different intensities can be observed, mainly differing in the co-expressions of CD193, CD14, CD123, CRTH2 (along the horizontal axis), and by simultaneous positive co-expression of CD4, CD3 with a negative co-expression of CD16 (on the vertical axis). Both axes report the variance explained by each component of the two PCs in the SCA model for all the patients. The loading vectors greatly differ from the loadings of the Control Model because they explain the variability of only the not-normal cells.
