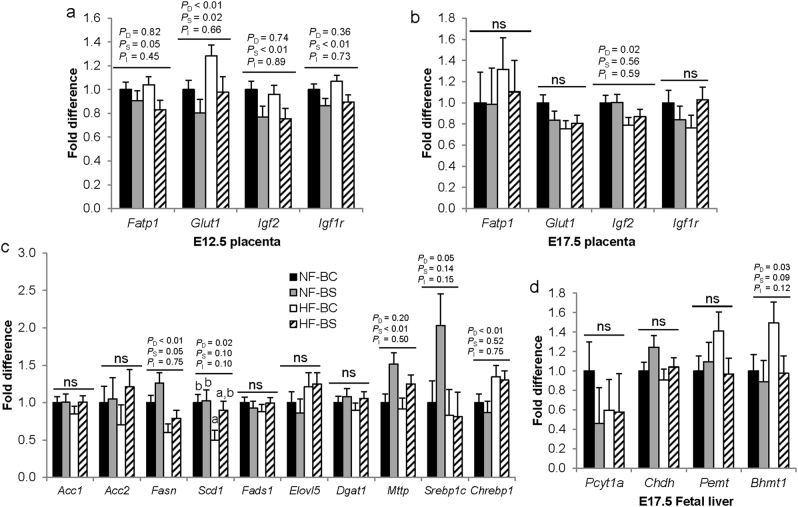
Fig. 4. Placental and fetal liver mRNA expression.
Placental transporter mRNA abundance at E12.5 (a) and E17.5 (b). c Fetal liver mRNA abundance of genes involved in lipid metabolism at E17.5. d Fetal liver mRNA abundance of genes involved in choline and betaine metabolism. n = 2 per dam and 6 dams per group; NF-BC (solid bars), NF-BS (shaded bars), HF-BC (open bars), HF-BS (hatched bars). Data were analyzed using the general linear model. PD, PS, and PI represent the P values of HF feeding, betaine supplementation, and their interaction respectively. Post hoc pair-wise comparisons were conducted with Tukey’s HSD correction if PI ≤ 0.1. Values are mean ± standard error of mean (SEM); different letters (a, b) indicate P < 0.05 in the pairwise analysis. ns not significant. Acc acetyl-CoA carboxylase, Acox1 peroxisomal acyl-coenzyme A oxidase 1, Bhmt betaine–homocysteine S-methyltransferase, Chdh choline dehydrogenase, Chrebp1 Carbohydrate-responsive element-binding protein, Dgat1 diacylglycerol O-acyltransferase 1, Elovl5 fatty acid elongase 5, Fasn fatty acid synthase, GPC glycerophosphocholine, Me methyl group, Mttp microsomal triglyceride transfer protein, Pcyt1a choline-phosphate cytidylyltransferase A, PC phosphatidylcholine, PE phosphatidylethanolamine, Pemt phosphatidylethanolamine N-methyltransferase, Scd1 stearoyl-CoA desaturase-1, Srebp1 sterol regulatory element-binding protein 1, BC no betaine control, BS betaine supplemented, HF high-fat diet, NF normal-fat diet

