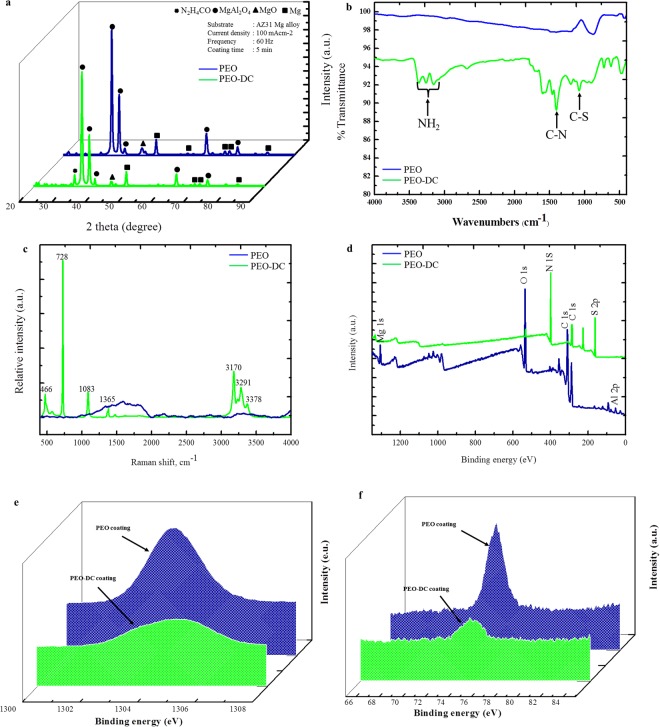
Figure 4.
(a) XRD patterns of the samples coated by plasma electrolytic oxidation (PEO), and samples coated by PEO process followed by DC with thiourea. Scan range, are from 20 to 90°; Cu Kα radiation source. (b) FT-IR spectra of the coated materials with and without thiourea. (c) Raman spectra of the (plasma electrolytic oxidation) PEO coatings and PEO coatings followed by dip-coating (DC) with thiourea. (d) Full XPS spectra of the PEO coatings and PEO coatings followed by DC with thiourea. Normalized, high-resolution XPS scan of (e) Mg and (f) Al for PEO coating alone and PEO-DC coating, respectively.

