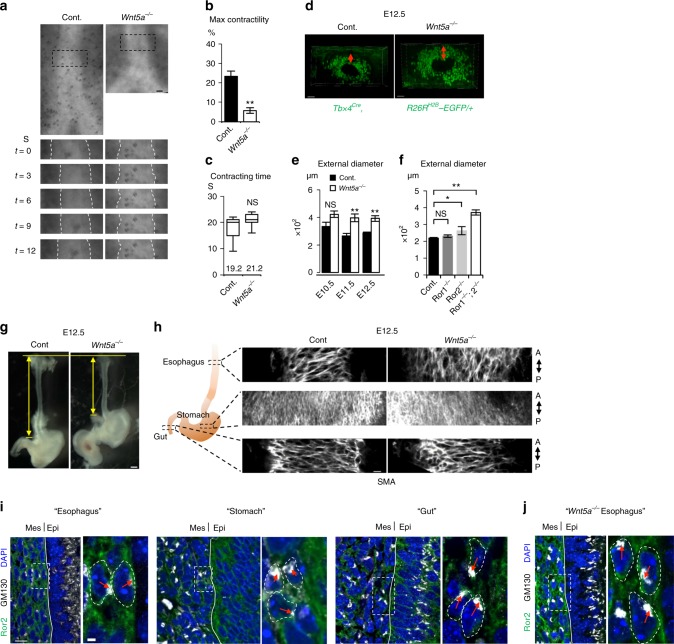
Fig. 5.
Wnt5a-Ror2 signaling controls contractility of SM and restricts radial expansion during tube elongation of developing trachea and esophagus. a Representative time-lapse sequence of contractile movement of tracheas. The black-dotted squares in upper are magnified in lower. White-dotted lines indicate epithelium–mesenchyme boundaries. See also Supplementary Movie 5. Maximal contractility (b) and contraction time (c) in a. Columns represent means ± SEM (n ≥ 3). Numbers represent means. For box and whisker plot, center line, box limits and whiskers represent mean, 25 and 75% confidence limits, and min and max values, respectively. (d) Thickness of tracheal mesenchyme in Tbx4Cre, R26RH2B-EGFP/+. Transversal views were shown. Red-arrows indicate thickness of mesenchyme. (e, f). External diameter of tracheal tube. (Control; n = 4–6, Wnt5a−/−; n = 3, Ror1−/− = 5, Ror2−/− = 5, Ror1−/−; Ror2-/- = 3). Each column represents the means ± SEM. P values (*P < 0.05, **P < 0.01) show the significance with Student’s t test (b, e) or the Tukey-Kramer method f. NS not significant. (g) Gross morphology of the esophagus at E12.5. Yellow arrows indicate the length of the esophagus. h SM tissue architecture of digestive organs at E12.5. Whole organs were stained for SMA (white). Coronal sections were shown. A anterior, P posterior. See also Supplementary Movie 6. i, j The polarity of subepithelial cells of digestive organs from wild type (i) and Wnt5a−/− (j). Ror2 (green), GM130 (white), and DAPI (blue). Dotty squares were magnified in right panels. Lines indicate boundaries between epithelium and mesenchyme. Red arrow indicates the position of Golgi-apparatus relative to nuclei. Scale bar; 50 μm (d), 20 μm (h), 10 μm (e, i, j; left), 2 μm (i, j; right panels)

