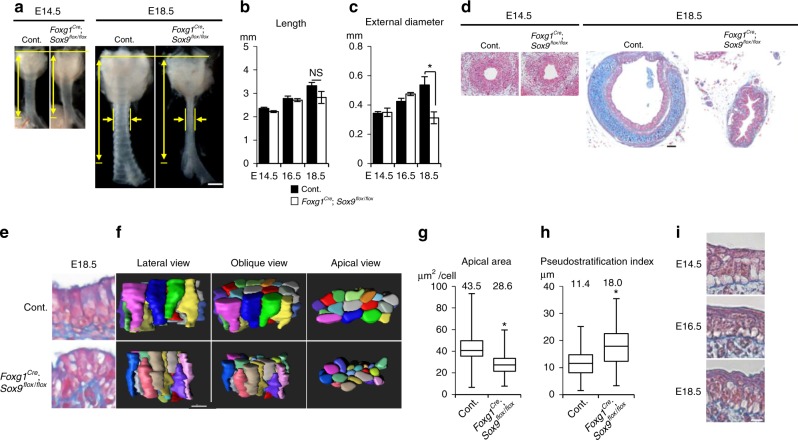
Fig. 6.
Cartilage development expands the tracheal but not esophageal diameter and promotes epithelial rearrangement for luminal enlargement. a Gross morphology of Foxg1Cre; Sox9flox/flox trachea and littermate control. Yellow arrows indicate length and diameter of the tracheas. Measurement of tracheal tube length (b) and external diameter (c). (Control; n = 5–8, Foxg1Cre; Sox9flox/flox; n = 3 or 4). d Azan staining of transversal sections. e Azan staining of Foxg1Cre; Sox9flox/flox trachea epithelium. f Representative 3D reconstructed images of epithelial-cell cluster (20 cells) of Foxg1Cre; Sox9flox/flox or littermate control at E18.5. (left, apical view; middle, oblique view; right, lateral view). See also Supplementary Movie 7. g Apical-surface area at E18.5. center line, box limits, and whiskers represent mean, 25 and 75% confidence limits, and min and max values, respectively. Numbers represent means. (Control, n = 119, Foxg1Cre; Sox9 flox/flox, n = 107). h Pseudostratification index at E18.5. center line, box limits, and whiskers represent mean, 25 and 75% confidence limits, and min and max values, respectively. Numbers represent means (Control, n = 130; Foxg1Cre; Sox9flox/flox, n = 84). (i) Azan staining of developing esophageal epithelium. P values (**P < 0.01, *P < 0.05) show the significance with Student’s t test (b, c, g, h). NS not significant. Scale bar = 500 μm (a), 50 μm (d), 10 μm (f), 5 μm (i)

