Figure 4.

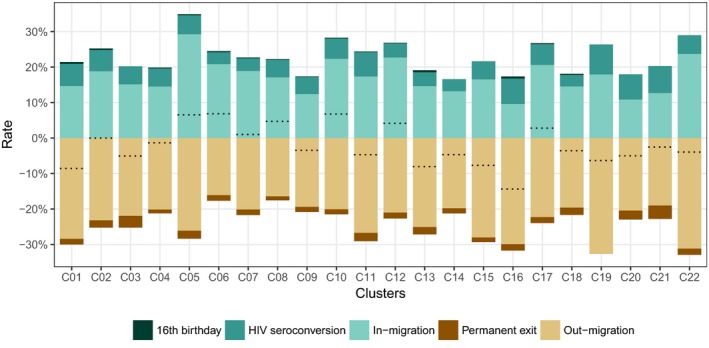
Annual growth rates of the resident PLWHIV population, by population change components and per cluster, ANRS 12249 TasP trial (2012 to 2016). Dotted lines indicate the sum of all rates, i.e. net annual population growth rate.

Annual growth rates of the resident PLWHIV population, by population change components and per cluster, ANRS 12249 TasP trial (2012 to 2016). Dotted lines indicate the sum of all rates, i.e. net annual population growth rate.