Figure 6.

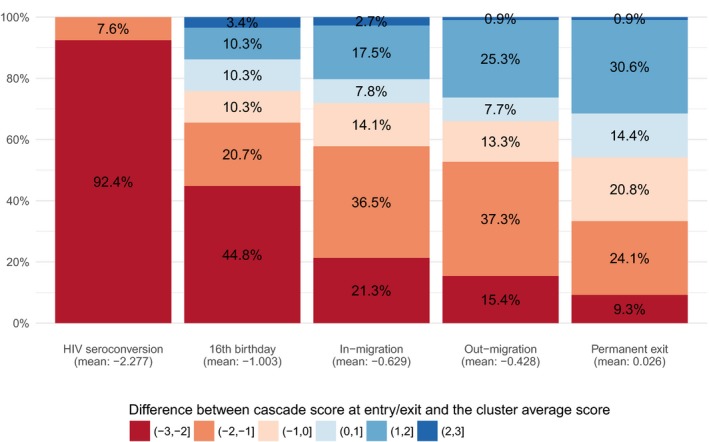
Distribution of the differences between HIV care cascade score at entry/exit and the cluster average score at the same date, by population change component, ANRS 12249 TasP trial (2012 to 2016).

Distribution of the differences between HIV care cascade score at entry/exit and the cluster average score at the same date, by population change component, ANRS 12249 TasP trial (2012 to 2016).