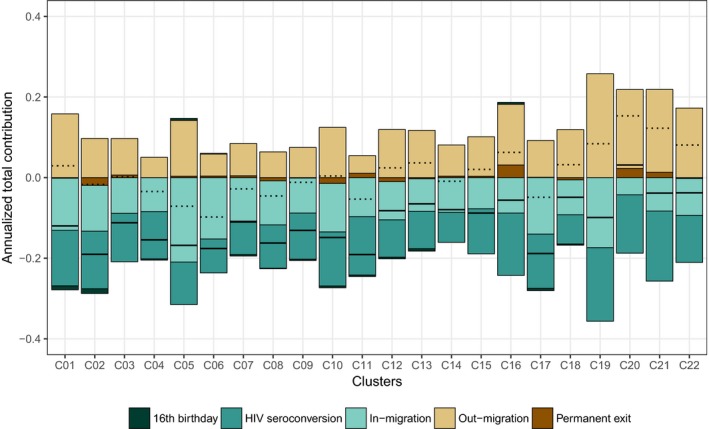
Figure 7.

Annualized total contribution of population change on cluster average cascade score, by component of population change and per cluster, ANRS 12249 TasP trial (2012 to 2016). Dotted lines indicate the sum of the total contribution of in‐ and out‐migration. Black lines indicate the sum of total contribution of all events. Examples of reading: in cluster C01, in‐migration events reduced annually the cluster average cascade score by 0.127 while out‐migration events increased it by 0.161. Therefore, the overall contribution of migration is +0.034 per year.
