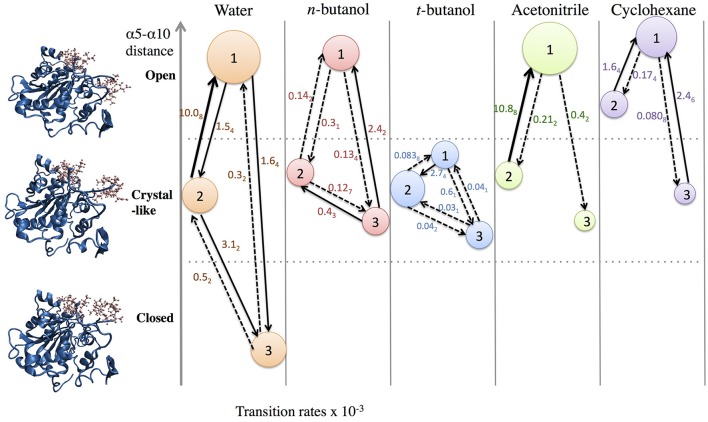
Figure 10.
Transition rates (x 10−3 ns−1) between conformational states, according to hidden Markov state model (uncertainties in last digit are given as subscript). The sizes of circles around states 1, 2, 3 indicate relative populations of each conformation. The fastest transitions are given in solid arrows; dashed arrows represent slow or infrequent conformational transitions.

