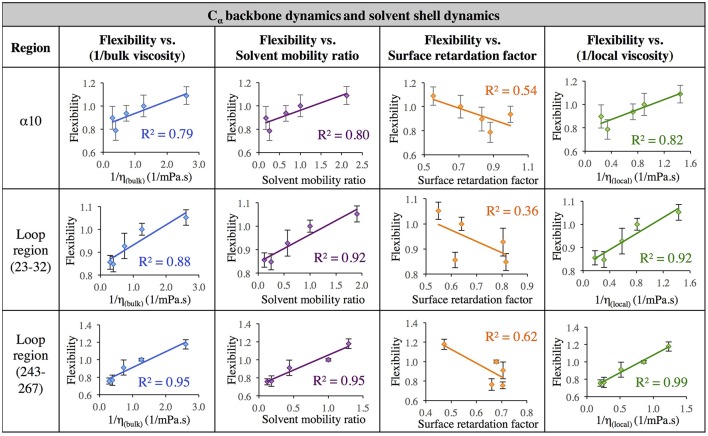
Figure 9.
Correlation of flexibility (calculated using protein Cα RMSF) with bulk viscosity (first column), solvent mobility ratio (second column), surface retardation factor (third column), and local solvent viscosity (fourth column) for the α10 secondary structure and two loop regions (residues 23–32, and residues 243–267).

