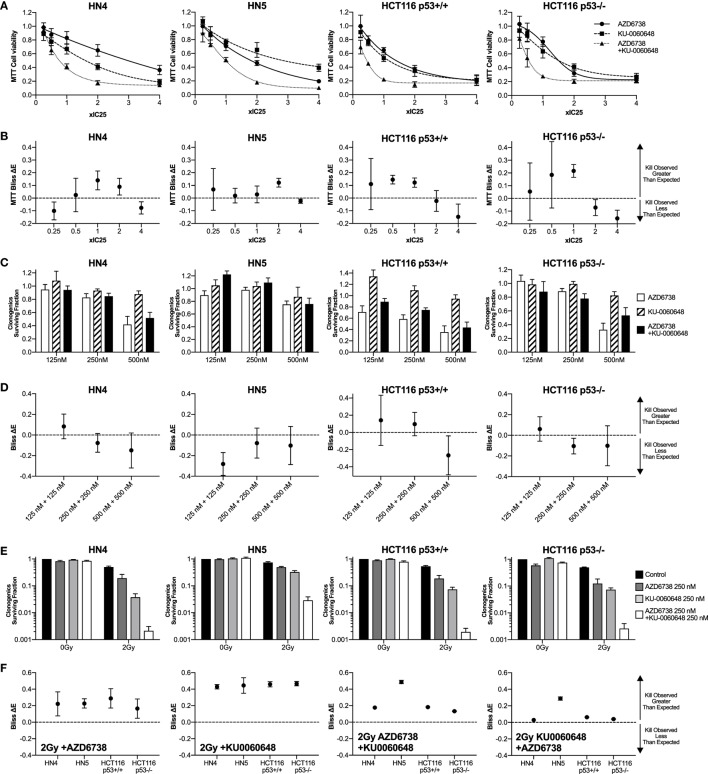
Figure 1.
DNA-PK inhibition enhances radiosensitization when added to ATR inhibition and radiation. (A) The combination of the ATR inhibitor AZD6738 and the DNA-PK inhibitor KU-0060648 was assessed by first determining cell viability 48 h after treatment by MTT analysis at 0.25×, 0.5×, 1×, 2×, and 4× IC50 doses. Dose–response curves were used initially to derive the following IC50 doses. For AZD6738, HN4, 1.5 µM; HN5, 1.5 µM; HCT116 p53+/+, 3.0 µM; and HCT116 p53−/−, 4.0 µM. For KU-0060648, HN4, 0.8 µM; HN5, 0.5 µM; HCT116 p53+/+, 1.5 µM; and HCT116 p53−/−, 1.5 µM. In subsequent combination experiments, these doses proved to be approximately IC25 doses and have been presented accordingly for accuracy. (B) Observed cell kill vs expected cell kill was determined by Bliss independence analysis. For example, ×1 IC50 + ×1 IC50 is the observed toxicity of this combination (expressed as 0 to 1 with 1 being maximum kill), minus the calculated “expected” effect if the individual values for ×1 IC50 AZD6738 and ×1 IC50 KU0060648 were expected to combine without any interaction. A positive ΔE corresponds to greater observed kill than expected for non-interacting combinations. Negative ΔE indicates less than expected cell kill. Further details outlined in the statistical analysis section of the methods. Greater than expected cell kill is indicated by ΔE and 95% confidence intervals (CIs) from observed data falling all above zero; less than expected cell kill where all values fall below zero. (C) Clonogenic survival was determined for AZD6738 and KU-0060648 alone and in combination across a range of doses. Values expressed as surviving fraction relative to untreated control. (D) Bliss analysis as described in panel (B). (E) Clonogenic survival was determined for combinations of AZD6738, KU-0060648, and 2 Gy radiation. Values expressed as surviving fraction relative to untreated control. (F) Bliss analysis as described in panel (B). (G) Comparison plots of the combination of 125 nM each of AZD6738 and KU0060648 vs 250 or 500 nM of individual drugs and the corresponding radiosensitization effect by clonogenics. All panels represent a minimum of three independent experiments ±SEM, except Bliss analysis in (B,D,F) where error bars are ±95% CIs. Statistical analysis performed between indicated conditions by unpaired t-test *P < 0.05.


