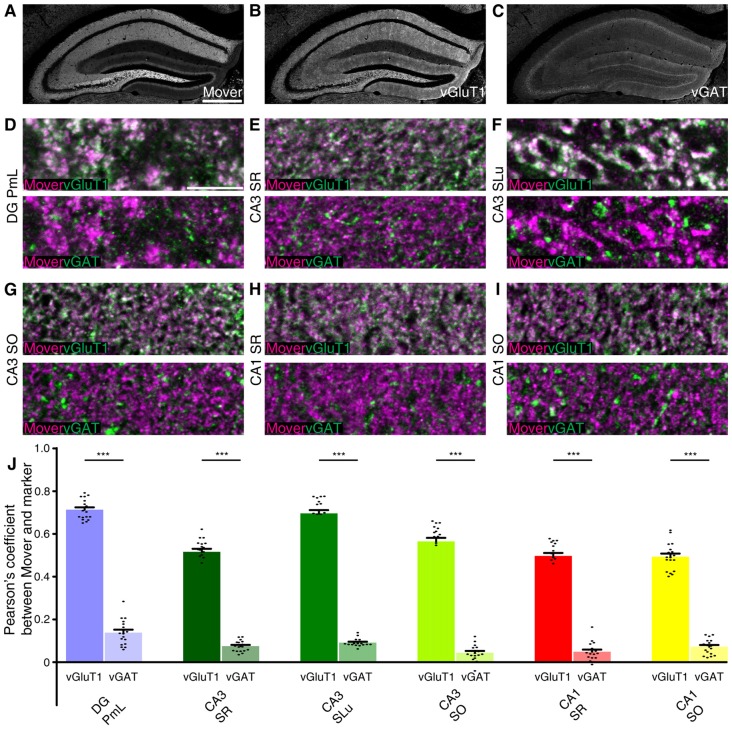
Figure 4.
Mover colocalization with presynaptic markers vesicular glutamate transporter 1 (vGluT1) and vesicular γ-aminobutyric acid (GABA) transporter (vGAT) in the mouse hippocampus. Immunofluorescence triple labeling of the mouse hippocampus. (A–C) Overview showing the heterogeneous mover expression pattern (A) and the corresponding vGluT1 (B) and vGAT staining (C). (D–I) Overlay of mover (magenta) and vGluT1 staining (green, upper panel) and mover (magenta) and vGAT (green, lower panel) in regions of the hippocampus where mover immunofluorescence was above average. (D) High colocalization of mover with vGluT1 in polymorph layer of DG, low colocalization of mover with vGAT. (E) High colocalization of mover with vGluT1 in stratum radiatum of CA3, low colocalization of mover with vGAT. (F) High colocalization of mover with vGluT1 in stratum lucidum of CA3, low colocalization of mover with vGAT. (G) High colocalization of mover with vGluT1 in stratum oriens of CA3, low colocalization of mover with vGAT. (H) High colocalization of mover with vGluT1 in stratum radiatum of CA1, low colocalization of mover with vGAT. (I) High colocalization of mover with vGluT1 in stratum oriens of CA1, low colocalization of mover with vGAT. (J) Visualization of the quantification of colocalization with the different markers using the Pearson’s correlation coefficient. Bars show average ± SEM; ***P < 0.001. PmL, polymorph layer of dentate gyrus; SR, stratum radiatum (of either CA3 or CA1); SLu, stratum lucidum of CA3; SO, stratum oriens (of either CA3 or CA1). Scale bar: (A–C) = 500 μm, (D–I) = 10 μm.

