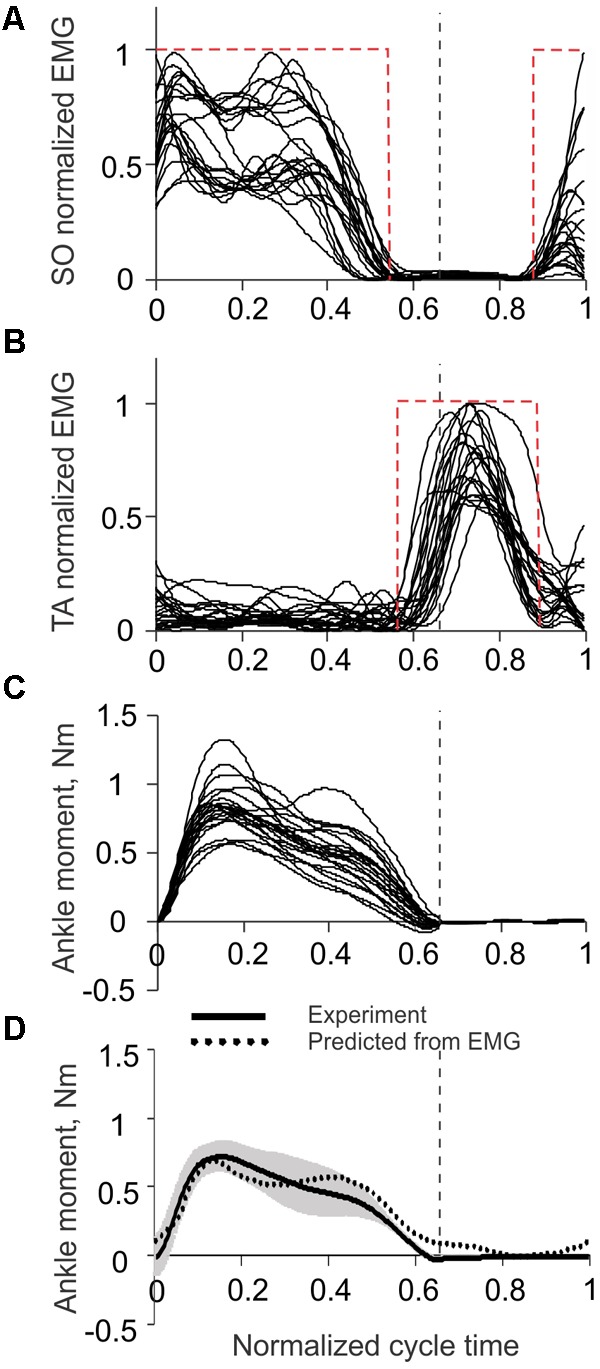
FIGURE 5.

Ankle joint moment and EMG activity of soleus (SO) and tibialis anterior (TA) muscles during level walking in the cat. The vertical dashed lines separate the stance and swing phases. Experimental EMG and ankle moment data are taken from 22 cycles of level walking of three cats (mass 3.55 ± 0.65 kg; mean ± SD) (Prilutsky et al., 2011; Markin et al., 2012). (A) Normalized SO EMG during level walking in the cat. The red dashed rectangle corresponds to emulated SO EMG signal (see text for details). (B) Normalized TA EMG during level walking in the cat. The red dashed rectangle corresponds to emulated TA EMG signal (see text for details). (C) Ankle joint moment during level walking in the cat; positive values correspond to extension (plantar flexion). (D) Ankle moment obtained experimentally (solid line with gray shade, mean ± SD) and predicted from SO and TA EMGs using Eq. 1 (dotted line). Positive values correspond to extension (plantar flexion).
