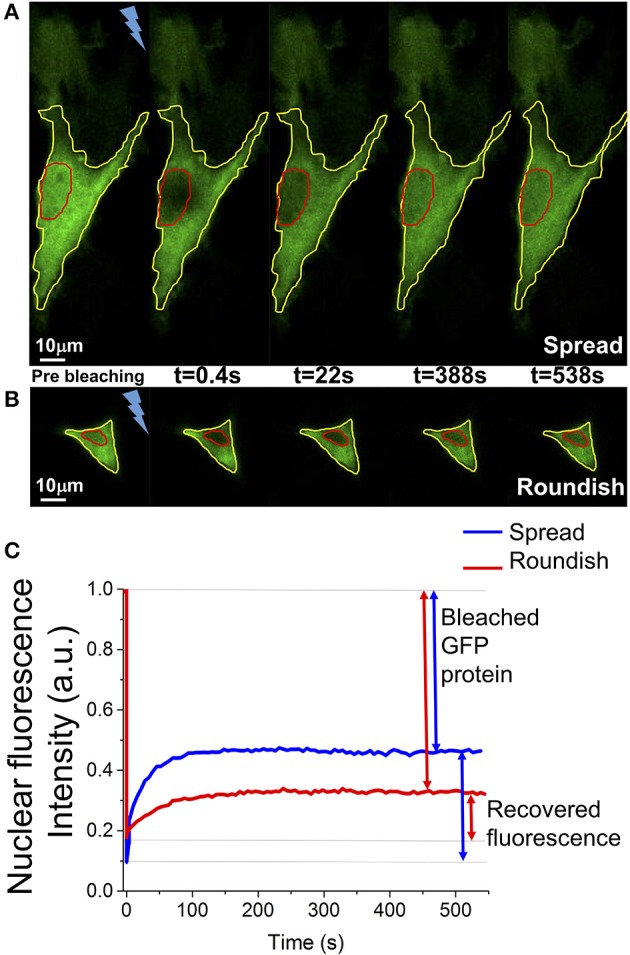
Figure 5.

Example of a FRAP experiment. (A,B) Representative images of the nuclear fluorescence recovery in a spread and a roundish MSC. In red is highlighted the nucleus, in yellow the cell edge. The bolt represents the fluorescence bleaching performed with the high-power Argon laser at 488 nm. (C) Representative graphs of the FRAP curve in one spread cell (blue line) and in one roundish cell (red line). The GFP protein ratio bleached during the measurement and the ratio of fluorescent GFP protein recovered into the cell nucleus are highlighted.
