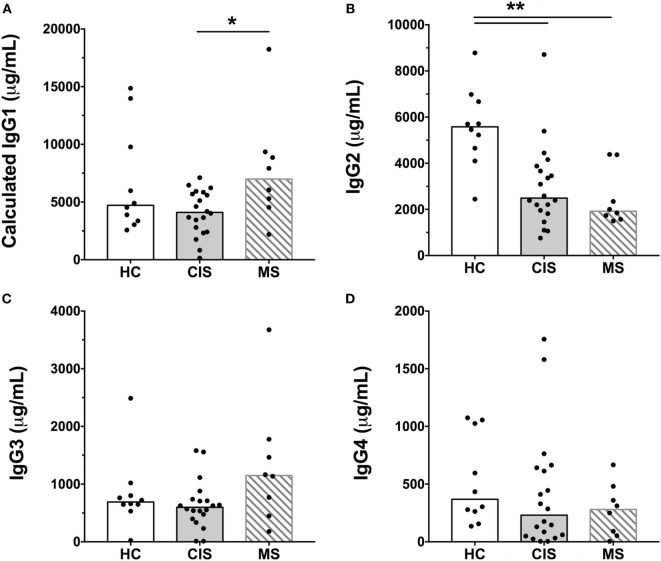
Figure 2.
Serum concentrations of IgG subclasses, (A) IgG1, (B) IgG2, (C) IgG3, and (D) IgG4 from healthy controls (HC) averaged over a 1-year collection period (n = 10; open bars) compared with people with recently diagnosed clinically isolated syndrome (CIS) (n = 20; shaded bars) and multiple sclerosis (MS) (n = 8, diagonal lines in bars). Individual values are shown and group medians are indicated by the horizontal bar. Statistically significant comparisons in Mann–Whitney tests (p < 0.05) are indicated with as asterisk and very significant comparisons (p < 0.01) are indicated with two asterisks.

