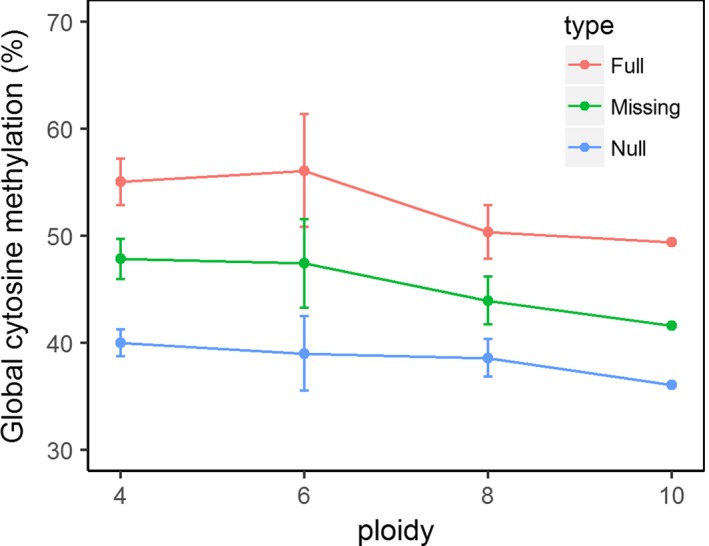
Figure 2.

Global cytosine methylation in Phragmites australis leaves from different ploidy levels. Each dot denotes the group mean, bars indicate ± standard error (SE), and colors indicate different scoring methods for treating the last band pattern of MSAP. The global cytosine methylation did not differ significantly across ploidy levels
