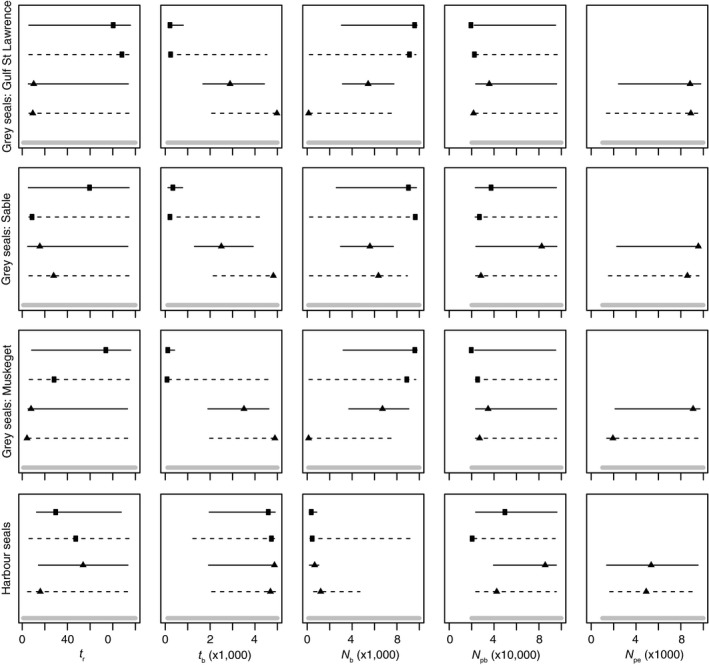
Figure 5.

Mean (± 95% confidence interval) posterior parameter estimates for scenarios 3 (square) and 4 (triangles) evaluated using 1000 SNPs with (dashed) and without (solid) a minimum minor allele frequency filter of 0.05. Gray lines at the bottom of each plot represent the prior. Scenarios and parameters as depicted in Figure 3. t r: time of recovery, t b: time of bottleneck, N b: population size during bottleneck; N pb: population size prior to the bottleneck; N pe: population size prior to the expansion
