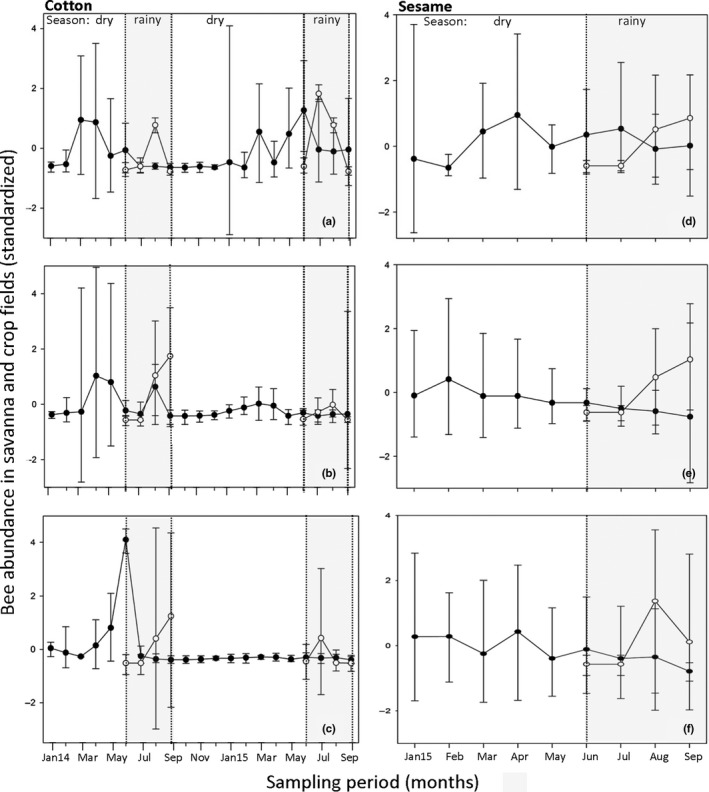
Figure 5.

Multiple line and scatter plot with error bars (median and 95% confidence interval) of bee abundance per month (data were standardized prior to analysis) at 12 savanna sites of 1 ha each (filled circles) and 11 cotton and 11 sesame fields (empty circles) in the Southwest of Burkina Faso. Only abundances of bee species occurring at both savanna sites and crop fields in each region were considered (low disturbance—Nazinga: Figure 5a,d; medium disturbance—Bontioli: Figure 5b,e; high disturbance—Dano: Figure 5c,f). Bee data from the cotton fields could only be collected during the rainy seasons of both years from June to September during the flowering period of the crop, as fields lay fallow during the rest of the year. Bee data in sesame fields were collected in 2015 only; hence, the spillover is only plotted for the sampling period in 2015. The sampling period for the savanna‐cotton spillover started in January 2014 (Jan14), for the savanna‐sesame spillover in January 2015 (Jan15)
