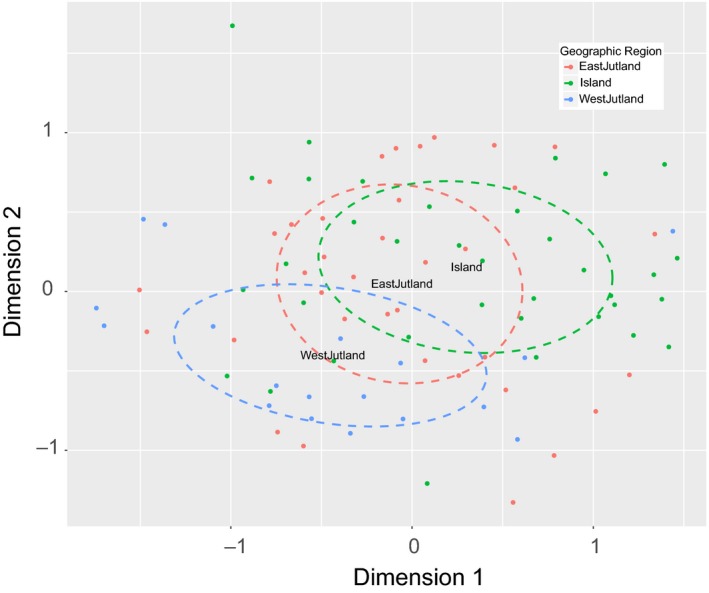
Figure 2.

Nonmetric multidimensional scaling plot based on 197 metabolic features showing a weak geographic signal between western Jutland (red) and the islands (blue), with eastern Jutland (green) intermediate between the two. 95% confidence intervals for the three geographic regions are shown in dashed lines
