Figure 3.

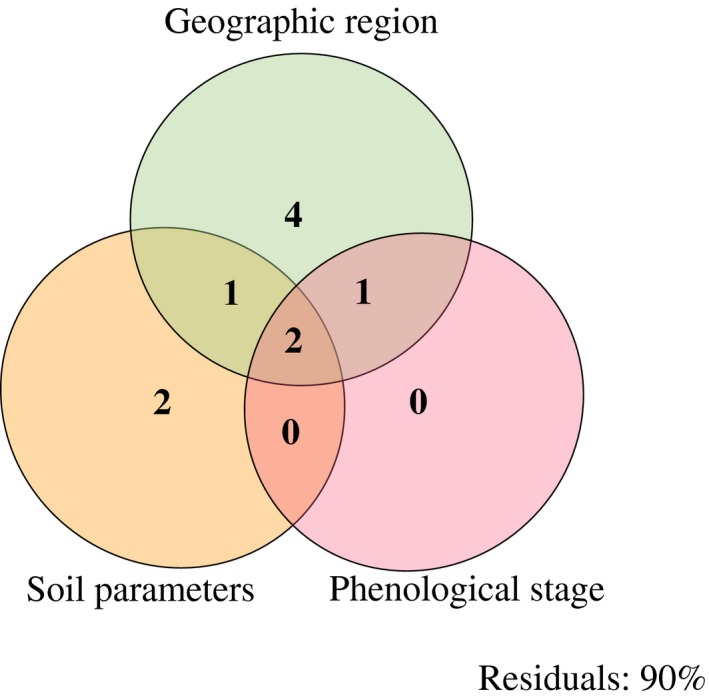
Results of the variation partition analyses for soil parameters (F = 2.03, p = 0.02), geographic region (F = 3.74, p < 0.001), and phenological stage (F = 1.93, p = 0.04), for all 197 metabolic features

Results of the variation partition analyses for soil parameters (F = 2.03, p = 0.02), geographic region (F = 3.74, p < 0.001), and phenological stage (F = 1.93, p = 0.04), for all 197 metabolic features