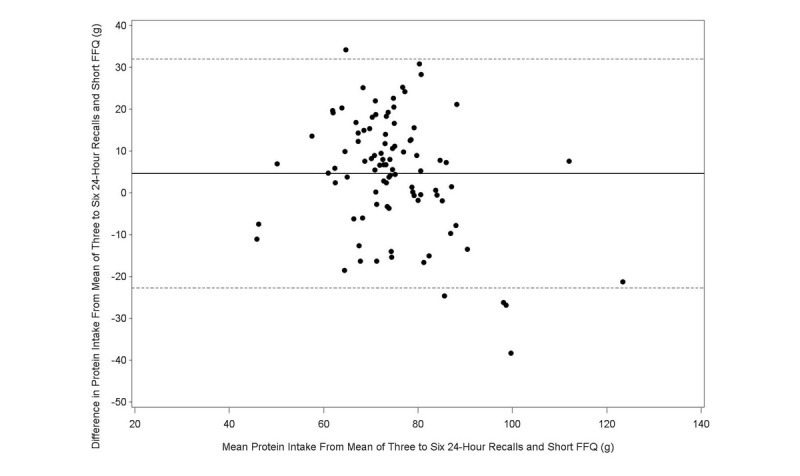
Figure 2.

Bland-Altman plots related to protein. Difference in the daily intake of energy-adjusted protein derived from the three to six 24-hour recalls and the short food frequency e-questionnaire (SFFeQ2) plotted against the corresponding mean energy-adjusted daily intakes derived from the two methods. Solid lines represent mean difference, and dashed lines show lower and upper 95% limits of agreement (mean ± 1.96 SD) (n=92).
