Abstract
The pentose phosphate pathway (PPP) is a fundamental component of cellular metabolism. It provides precursors for the biosynthesis of nucleotides and contributes to the production of reducing power in the form of NADPH. It has been hypothesized that mammalian cells may contain a hidden reaction in PPP catalyzed by transketolase-like protein 1 (TKTL1) that is closely related to the classical transketolase enzyme; however, until now there has been no direct experimental evidence for this reaction. In this work, we have applied state-of-the-art techniques in 13C metabolic flux analysis (13C-MFA) based on parallel labeling experiments and integrated flux fitting to estimate the TKTL1 flux in CHO cells. We identified a set of three parallel labeling experiments with [1-13C]glucose+[4,5,6-13C]glucose, [2-13C]glucose+[4,5,6-13C]glucose, and [3-13C]glucose+[4,5,6-13C]glucose and developed a new method to measure 13C-labeling of fructose 6-phosphate by GC-MS that allows intuitive interpretation of mass isotopomer distributions to determine key fluxes in the model, including glycolysis, oxidative PPP, non-oxidative PPP, and the TKTL1 flux. Using these tracers we detected a significant TKTL1 flux in CHO cells at the stationary phase. The flux results suggest that the main function of oxidative PPP in CHO cells at the stationary phase is to fuel the TKTL1 reaction. Overall, this study demonstrates for the first time that carbon atoms can be lost in the PPP, by means other than the oxidative PPP, and that this loss of carbon atoms is consistent with the hypothesized TKTL1 reaction in mammalian cells.
Keywords: Pentose phosphate pathway, metabolic model validation, TKTL1, transketolase, isotopic tracers
1. INTRODUCTION
The pentose phosphate pathway (PPP) is a fundamental component of cellular metabolism. Together with glycolysis, it is believed to be one of the oldest metabolic pathways with a very ancient evolutionary origin (Keller et al., 2014). The main role of PPP is to generate precursors for synthesis of nucleotides (from ribose 5-phosphate, R5P), aromatic amino acids in microbial systems (from erythrose 4-phosphate, E4P), and reducing equivalents in the form of NADPH for reductive biosynthetic reactions (e.g. fatty acid and amino acid biosynthesis) and to combat oxidative stress. The PPP consists of two branches, an irreversible oxidative branch (oxPPP) and a reversible non-oxidative branch (noxPPP).
Recently, novel hidden reactions were uncovered in E. coli in PPP using 13C-tracer experiments (Nakahigashi et al., 2009). It has been hypothesized that mammalian cells may also contain a hidden reaction in PPP catalyzed by transketolase-like protein 1 (TKTL1) (Coy et al., 2005). Transketolase-like protein 1 is an enzyme encoded by the TKTL1 gene that is closely related to the classical transketolase (TKT) gene (Coy et al., 1996). Expression of TKTL1 has been linked to poor prognosis of various cancers (Coy et al., 2005; Grimm et al., 2014; Kayser et al., 2011; Krockenberger et al., 2007; Langbein et al., 2006; Song et al., 2015; Volker et al., 2007), and was found to correlate with high rates of cell proliferation (Hu et al., 2007; Xu et al., 2009). Additionally, gene silencing of TKTL1 by RNAi was shown to strongly inhibit cell growth of cancer cells (Shi et al., 2015; Xu et al., 2009), thus suggesting TKTL1 as a potential target for therapeutic interventions (Coy et al., 2005; Langbein et al., 2008; Volker et al., 2007). TKTL1 is believed to catalyze the reaction that cleaves xylulose 5-phosphate (X5P) to produce glyceraldehyde 3-phosphate (GAP) and acetyl-CoA (AcCoA); however, there is still very little experimental evidence for this reaction in mammalian systems (Meshalkina et al., 2013). In microbial systems, a similar reaction (i.e. phosphoketolase) was recently discovered in cyanobacteria (Xiong et al., 2016) and clostridia (Liu et al., 2012) when grown on xylose as the carbon source.
In this study, we have applied state-of-the-art methods in 13C-metabolic flux analysis (13C-MFA) based on parallel labeling experiments (Antoniewicz, 2015b; Crown and Antoniewicz, 2013) to provide evidence for the existence of TKTL1 flux in CHO cells. First, we determined that isotopic tracers that are traditionally used for quantifying metabolic fluxes in PPP, including [1,2-13C]glucose and [1-13C]glucose+[U-13C]glucose, are not well suited to estimate the TKTL1 flux. We then applied recently developed techniques for optimal design of labeling experiment (Antoniewicz, 2013; Crown et al., 2012; Crown and Antoniewicz, 2012) to identify novel isotopic tracers that were optimal for quantifying TKTL1 flux with high precision. Moreover, we developed a new method for measuring 13C-labeling of fructose 6-phosphate by GC-MS to improve flux resolution. Using these new tracers and new labeling measurements we detected a significant TKTL1 flux in CHO cells at the stationary phase. This study thus demonstrates for the first time that carbon atoms can be lost in the PPP, by means other than the oxPPP, and that this loss of carbon atoms is consistent with the hypothesized TKTL1 reaction.
2. MATERIALS AND METHODS
2.1. Materials
Culture materials were purchased from Cellgro (Mediatech, Manassas, VA). Chemicals were purchased from Sigma-Aldrich (St. Louis, MO). [1-13C]Glucose (99.5 atom% 13C), [2-13C]glucose (99.5%), [3-13C]glucose (99.5%), and [4,5,6-13C]glucose (99.8%) were purchased from Cambridge Isotope Laboratories (Andover, MA). Glucose stock solutions were prepared at 250 g/L in phosphate buffer saline (PBS). For experiments involving tracer mixtures, new glucose stock solutions were prepared by mixing the appropriate stock solutions at the desired ratio. The growth medium was Dulbecco’s modified Eagle medium (DMEM, Cat. No. 10-013-CV) supplemented with 10% fetal bovine serum (FBS, Cat. No. 35-011-CV) and 1% penicillin-streptomycin solution (PS, Cat No. 30-004-CI).
2.2. Cell culture and parallel labeling experiments
CHO-K1 cells (ATCC Cat. No. CCL-61) were grown as monolayer culture in T-25 flasks (Corning, NY, Cat. No. 430639) in a humidified incubator at 37°C with 5% CO2 until stationary phase (day 5 of culture) as described previously (Ahn and Antoniewicz, 2013). On day 5, a bolus of glucose was added to the cultures containing one of the following tracer combinations: a 1:1 mixture of [1-13C]glucose and [4,5,6-13C]glucose; a 1:1 mixture of [2-13C]glucose and [4,5,6-13C]glucose; or a 1:1 mixture of [3-13C]glucose and [4,5,6-13C]glucose. After 9 h incubation with the tracers, cells were harvested and intracellular metabolites were extracted for GC-MS analysis as described previously (Ahn and Antoniewicz, 2011). Previously, we validated that intracellular metabolites in upper metabolism reach isotopic steady state within 3 hrs after the addition of 13C-glucose tracers under these conditions (Ahn and Antoniewicz, 2011; Ahn and Antoniewicz, 2013).
2.3. Gas chromatography-mass spectrometry analysis
GC-MS analysis was performed using an Agilent 7890A GC equipped with a DB-5ms (30 m × 0.25 mm i.d. × 0.25 µm; Agilent J&W Scientific) capillary column, interfaced with a Waters Quattro Micro GC-MS/MS (Milford, MA) operating under ionization by electron impact at 70 eV and 200°C ion source temperature. The injection port and interface temperatures were both 250°C. Helium flow was maintained at 1 mL/min. Mass spectra were recorded in selected ion recording (SIR) mode with 30 ms dwell time. Mass isotopomer distributions were obtained by integration of ion chromatograms (Antoniewicz et al., 2007a), and corrected for natural isotope abundances (Fernandez et al., 1996) using the Metran software (Yoo et al., 2008).
Labeling of intracellular metabolites was determined by GC-MS analysis of tert-butyldimethylsilyl (TBDMS) derivatives as described previously (Ahn and Antoniewicz, 2011). Specifically, mass isotopomer distributions of 3-phosphoglycerate (3PG fragment m/z 585), phosphoenolpyruvate (PEP fragment m/z 453), and dihydroxyacetone phosphate (DHAP fragment m/z 484) were quantified. Labeling of glucose in the medium was determined by GC-MS analysis of the di-o-isopropylidene propionate derivative of glucose (Antoniewicz et al., 2011). Specifically, the mass isotopomer distribution of the fragment at m/z 301 was quantified, which contains all six carbon atoms glucose (Antoniewicz et al., 2011).
2.4. GC-MS analysis of intracellular fructose 6-phosphate
In this work, we have also developed a new method to measure 13C-labeling of intracellular fructose 6-phosphate (F6P) by GC-MS, after dephosphorylation of F6P (and FBP) with alkaline phosphatase to fructose, followed by methoxylamine (MOX)-TMS derivatization. The protocol for the enzymatic dephosphorylation was a modified version of the method described in (White, 2004): 100 μL of water and 50 μL of glycine buffer (0.1 M of glycine in pH 10.4, 1 mM of Zn acetate, and 1 mM of MgCl2) were added to dried intracellular metabolites. Next, 5 μL (ca. 0.3 IU) of alkaline phosphatase from E. coli (Sigma, Cat. No. P4377-100UN) was added and the samples were briefly vortexed. After incubation at 37°C for 1 h, the samples were dried under nitrogen gas at 37°C. The dephosphorylated metabolites were then dissolved in 33 µL of 2wt% methoxylamine hydrochloride in pyridine and incubated at 37°C for 90 min. Next, 67 µL of N-methyl-N-(trimethylsilyl)trifluoroacetamide (MSTFA) + 1% chlorotrimethylsilane (TMCS) was added (Thermo Scientific, Cat. No. TS-48915) and the samples were incubated at 60°C for 30 min. After an overnight incubation at room temperature, the derivatized samples were centrifuged and the clear liquid was transferred into GC vials for GC-MS analysis. For GC-MS analysis, 1 μL was injected in splitless mode. The oven temperature was held at 80°C for 2 min, increased to 280°C at 7°C/min and held for 4.43 min. The total run time was 35 min. Mass spectra of two fructose fragments (derived from F6P) were measured: m/z 307 (C12H31O3Si3) containing carbon atoms C4-C6 of F6P, and m/z 364 (C14H34O4NSi3) containing carbon atoms C1-C4 of F6P.
2.5. Metabolic network model and 13C-metabolic flux analysis
13C-MFA was performed using the Metran software (Yoo et al., 2008), which is based on the elementary metabolite units (EMU) framework (Antoniewicz et al., 2007b; Young et al., 2008). The metabolic network model used for 13C-MFA is given in Table 1. The model contains reactions for glycolysis and pentose phosphate pathway, as well as the hypothesized TKTL1 reaction: xylose 5-phosphate (X5P) → glyceraldehyde 3-phosphate (GAP) + acetyl-CoA (AcCoA). Metabolic fluxes were estimated by minimizing the variance-weighted sum of squared residuals (SSR) between the experimentally measured and model predicted mass isotopomer distributions. For combined analysis of parallel labeling experiments, multiple data sets were fit simultaneously to one flux model as described in (Crown et al., 2015; Leighty and Antoniewicz, 2013). Flux estimation was repeated at least 10 times starting with random initial values for all fluxes to find a global solution.
Table 1.
Metabolic network model for 13C metabolic flux analysis. For each metabolite carbon atoms are identified using letters to represent successive carbon atoms.
| Glycolysis | |||
|---|---|---|---|
| v1 | Gluc.ext (abcdef) | → | G6P (abcdef) |
| v2 | G6P (abcdef) | ↔ | F6P (abcdef) |
| v3 | F6P (abcdef) | ↔ | FBP (abcdef) |
| v4 | FBP (abcdef) | ↔ | DHAP (cba) + GAP (def) |
| v5 | DHAP (abc) | ↔ | GAP (abc) |
| v6 | GAP (abc) | ↔ | 3PG (abc) |
| v7 | 3PG (abc) | ↔ | PEP (abc) |
| v8 | PEP (abc) | → | Pyr (abc) |
| Pentose Phosphate Pathway | |||
| v9 | G6P (abcdef) | → | Ru5P (bcdef) + CO2 (a) |
| v10 | Ru5P (abcde) | ↔ | X5P (abcde) |
| v11 | Ru5P (abcde) | ↔ | R5P (abcde) |
| v12 | X5P (abcde) | ↔ | EC2 (ab) + GAP (cde) |
| v13 | F6P (abcdef) | ↔ | EC2 (ab) + E4P (cdef) |
| v14 | S7P (abcdefg) | ↔ | EC2 (ab) + R5P (cdefg) |
| v15 | F6P (abcdef) | ↔ | EC3 (abc) + GAP (def) |
| v16 | S7P (abcdefg) | ↔ | EC3 (abc) + E4P (defg) |
| TKTL1 reaction | |||
| v17 | X5P (abcde) | → | AcCoA (ab) + GAP (cde) |
Reversible reactions were modeled as separate forward and backward fluxes. Net and exchange fluxes were determined as follows: vnet = vf-vb; vexch = min(vf, vb). For visual representation of exchange fluxes, the exchange fluxes were rescaled as follows: exchange flux (%) = 100% × vexch / (100 + vexch). In 13C-MFA, we also accounted for potential dilutions of intracellular metabolites by determining the percent isotopic labeling for each measured metabolite, which was captured by the G-value (Ahn and Antoniewicz, 2013). At convergence, the fitting results were subjected to a chi-square statistical test to assess the goodness-of-fit, and accurate 95% confidence intervals were computed for all estimated parameters by evaluating the sensitivity of SSR to flux variations (Antoniewicz, 2015a). Precision of estimated fluxes was determined as follows (Antoniewicz et al., 2006):
Flux precision (stdev) = [(flux upper bound 95%) – (flux lower bound 95%)] / 4
3. RESULTS
3.1. Selection of optimal 13C-tracers for measuring TKTL1 flux
Optimal selection of isotopic tracers is critical for determining precise metabolic fluxes using 13C-MFA. Currently, the most widely used 13C-tracers for measuring fluxes in PPP are [1,2-13C]glucose and mixtures of [1-13C]glucose and [U-13C]glucose. To determine if either of these tracer schemes would allow the TKTL1 flux to be estimated accurately we simulated tracer experiments for various flux scenarios, both with and without TKTL1 flux. The simulation results revealed that neither tracer scheme would allow the TKTL1 flux to be determined with high precision. Next, we applied the EMU-BV methodology (Crown et al., 2012; Crown and Antoniewicz, 2012) to identify optimal tracers to estimate the TKTL1 flux, assuming that mass isotopomer distributions of 3PG and/or PEP would be measured by GC-MS. We determined that a set of three parallel labeling experiments would be optimal for quantifying the TKTL1 flux, namely parallel labeling experiments containing 1:1 mixtures of [1-13C]glucose and [4,5,6-13C]glucose; [2-13C]glucose and [4,5,6-13C]glucose; and [3-13C]glucose and [4,5,6-13C]glucose.
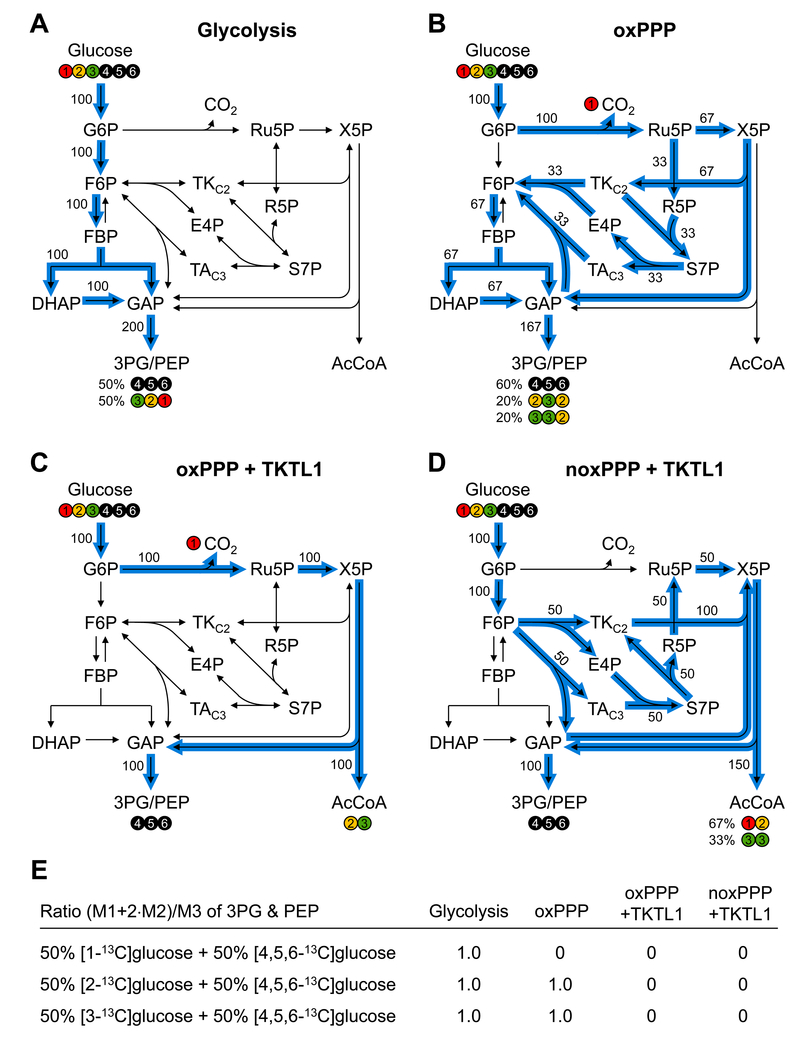
To provide more insight into the specific choice of these tracers, Figure 1 shows the expected fates of carbon atoms for four key flux scenarios: 1) glycolysis only; 2) oxPPP without TKTL1 flux; 3) maximum TKTL1 flux fueled by oxPPP; 4) maximum TKTL1 flux fueled by noxPPP. For flux scenario 1 (i.e. glycolysis only), the ratio of mass isotopomers (M1+2*M2)/M3 for 3PG and PEP is expected to be 1.0 for all three tracer schemes. For flux scenario 2 (i.e. oxPPP without TKTL1), the (M1+2*M2)/M3 ratio will be 0 for [1-13C]glucose+[4,5,6-13C]glucose, and will be 1.0 for the other two tracer schemes. For flux scenarios 3 and 4 (i.e. maximum TKTL1 flux), the (M1+2*M2)/M3 ratio will be 0 for all three tracer schemes. Thus, by measuring the (M1+2*M2)/M3 ratio for 3PG and/or PEP for the tracer schemes [2-13C]glucose+[4,5,6-13C]glucose and [3-13C]glucose+[4,5,6-13C]glucose, we can get a direct readout of the relative TKTL1 flux. Note that latter two tracer experiments, i.e. [2-13C]glucose+[4,5,6-13C]glucose and [3-13C]glucose+[4,5,6-13C]glucose, provide redundant information to allow us to validate the metabolic model and estimate a precise TKTL1 flux.
Figure 1.
Selection of isotopic tracers for quantifying the TKTL1 flux. The fate of glucose carbon atoms is tracked for four flux scenarios: (A) glycolysis; (B) oxPPP; (C) maximum TKTL1 flux fueled by oxPPP; and (D) maximum TKTL1 flux fueled by noxPPP. (E) The expected ratios of mass isotopomers (M1+2*M2)/M3 for 3PG and PEP for all four flux scenarios and three tracer combinations: [1-13C]glucose+[4,5,6-13C]glucose, [2-13C]glucose+[4,5,6-13C]glucose, and [3-13C]glucose+[4,5,6-13C]glucose. The (M1+2*M2)/M3 ratio for the first tracer combination is related to oxPPP flux, and the (M1+2*M2)/M3 ratio for the last two tracer combinations is related to TKTL1 flux.
3.2. Parallel labeling experiments with CHO cells
In a previous study, we performed parallel labeling experiments with [1,2-13C]glucose and [U-13C]glutamine to quantify metabolic fluxes in CHO cells in fed-batch culture (Ahn and Antoniewicz, 2013). Importantly, we demonstrated that at the stationary phase: 1) oxPPP was highly active, and 2) there was significant loss of carbon atoms in the upper part of metabolism, either in the glycolysis pathway or PPP, although at that time we didn’t have enough information to precisely determine where the carbon atoms were lost. Here, we wanted to test if the unexplained loss of carbon atoms could be attributed to TKTL1.
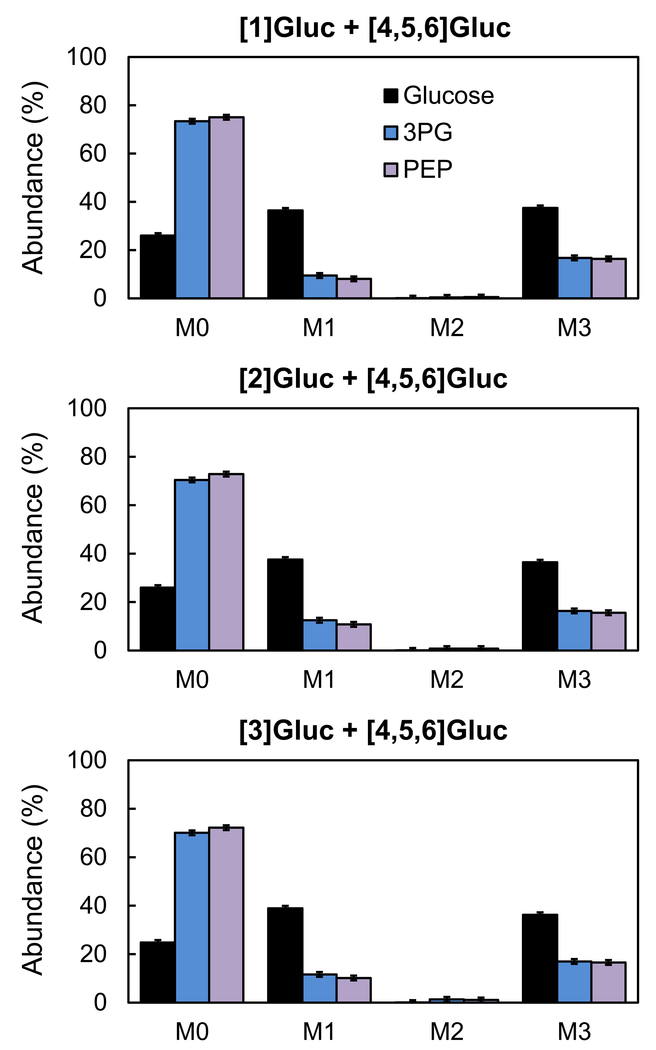
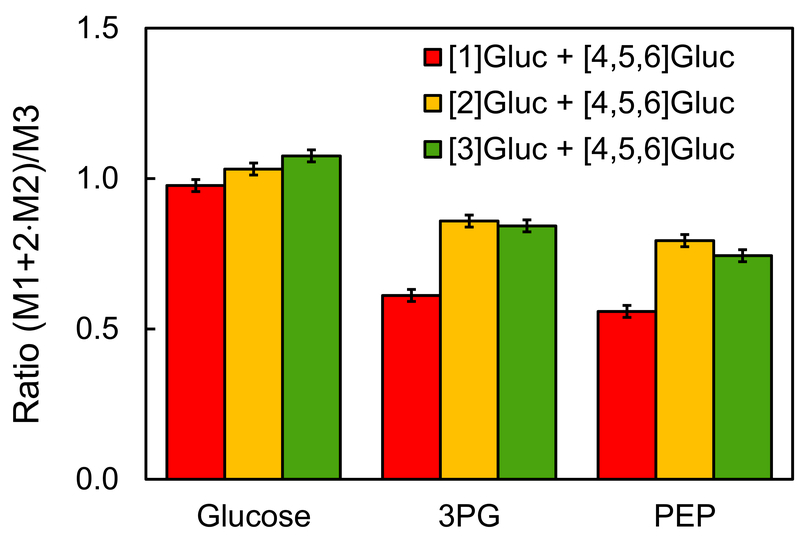
We performed parallel labeling experiments using the same CHO cell line under the same experimental conditions and applied the three optimal tracers identified above, i.e. [1-13C]glucose+[4,5,6-13C]glucose; [2-13C]glucose+[4,5,6-13C]glucose; and [3-13C]glucose+[4,5,6-13C]glucose. Tracers were added at the stationary phase as a bolus resulting in approximately 37.5% M1 labeling, 37.5% M3 labeling and 25% M0 labeling of glucose in the medium, which was validated by GC-MS analysis (Supplemental Materials). The 25% unlabeled glucose was due to the presence of unlabeled glucose in the medium prior to the addition of the tracers. After 9 h incubation with the tracers, intracellular metabolites were extracted and labeling of TBDMS derivatized intracellular metabolites was measured by GC-MS (Supplemental Materials). Figure 2 shows the measured mass isotopomer distributions of glucose, 3PG and PEP from the three parallel labeling experiments (after correction for natural isotope abundances). Figure 3 shows the calculated (M1+2*M2)/M3 ratios for the three metabolites. For 3PG and PEP, the (M1+2*M2)/M3 ratio was 58±2% for [1-13C]glucose+[4,5,6-13C]glucose, 82±2% for [2-13C]glucose+[4,5,6-13C]glucose, and 79±2% for [3-13C]glucose+[4,5,6-13C]glucose. The low (M1+2*M2)/M3 ratio for the tracer experiment with [1-13C]glucose+[4,5,6-13C]glucose indicates that a significant portion of glucose was metabolized by oxPPP where the first carbon atom is lost as CO2. The fact that the ratio was also significantly less than 1.0 for [2-13C]glucose+[4,5,6-13C]glucose and [3-13C]glucose+[4,5,6-13C]glucose tracer experiments suggests that TKTL1 was active in CHO cells at the stationary phase, resulting in loss of glucose carbon atoms C2 and C3 in approximately equal amounts.
Figure 2.
Mass isotopomer distributions of glucose, 3PG and PEP from parallel labeling experiments with [1-13C]glucose+[4,5,6-13C]glucose, [2-13C]glucose+[4,5,6-13C]glucose, and [3-13C]glucose+[4,5,6-13C]glucose. The mass isotopomer distributions were corrected for natural isotope abundances.
Figure 3.
The (M1+2*M2)/M3 mass isotopomer ratios for glucose, 3PG and PEP from parallel labeling experiments with [1-13C]glucose+[4,5,6-13C]glucose, [2-13C]glucose+[4,5,6-13C]glucose, and [3-13C]glucose+[4,5,6-13C]glucose.
3.3. 13C-Metabolic flux analysis
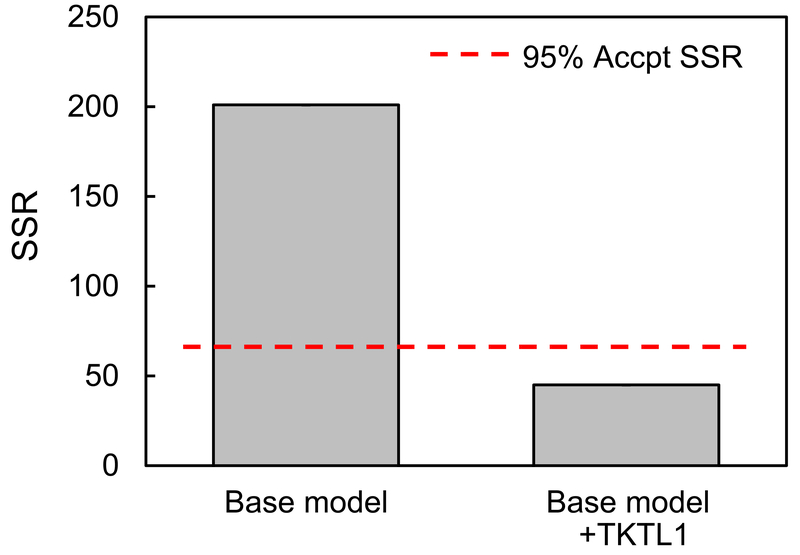
The results described above provide qualitative insights into relative metabolic fluxes. To rigorously quantify metabolic fluxes in this system, 13C-labeling data for intracellular PEP, 3PG and DHAP from the three parallel labeling experiments were fitted simultaneously to a single flux model to estimate fluxes. We obtained a statistically acceptable fit using the network model that contained the TKTL1 reaction. To provide additional support for the presence of the TKTL1 reaction, we also developed a new method for measuring 13C-labeling of two F6P fragments by GC-MS (m/z 307 C4-C6 of F6P, and m/z 364 C1-C4 of F6P), after dephosphorylation of F6P with alkaline phosphatase to form fructose and MOX-TMS derivatization (Figure 4). When F6P labeling data was added and 13C-MFA was repeated, we obtained a statistically acceptable fit only using the network model that contained the TKTL1 reaction, i.e. the base model without the TKTL1 reaction did not produce an acceptable fit (Figure 5), thus providing support for the presence of the TKTL1 reaction.
Figure 4.
Procedure for GC-MS analysis of fructose 6-phosphate (F6P) labeling. F6P is first dephosphorylated with E. coli alkaline phosphatase and the resulting fructose is derivatized with MOX-TMS. Two fragments are then measured by GC-MS: m/z 307 containing carbon atoms C4-C6 of F6P, and m/z 364 containing carbon atoms C1-C4 of F6P.
Figure 5.
Goodness-of-fit analysis provides support for the presence of TKTL1 reaction. The base model (i.e. without TKTL1 reaction) did not produce a statistically acceptable fit of 13C-labeling data, i.e. the minimized SSR value was higher than the maximum acceptable SSR value at 95% confidence level. Only the model with the TKTL1 reaction produced a statistically acceptable fit.
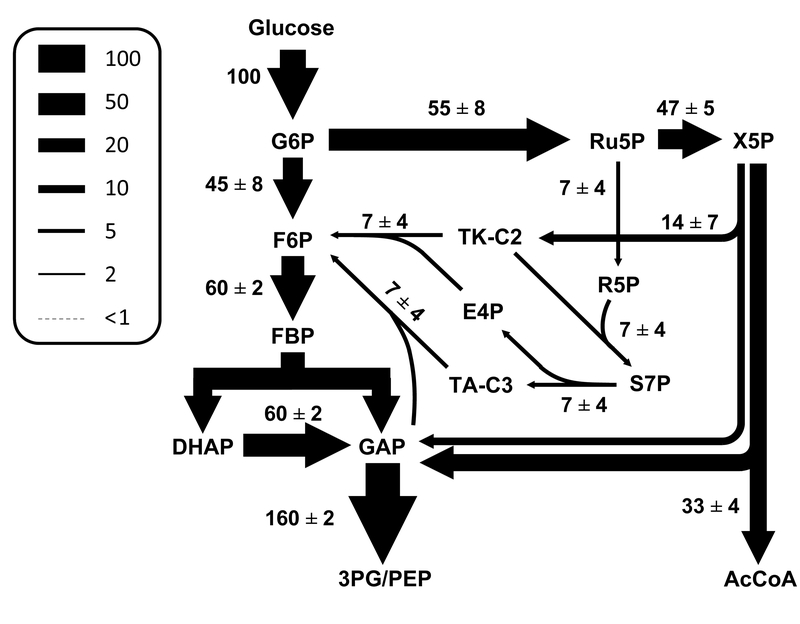
The estimated metabolic fluxes (normalized to glucose uptake rate) are shown in Figure 6. The complete flux results are also provided in Supplemental Materials, including 95% confidence intervals for all fluxes. The 13C-MFA results revealed that 45±8% of glucose was metabolized by glycolysis and 55±8% by oxPPP. A large fraction of ribulose 5-posphate that was formed via oxPPP was further converted to X5P to fuel the TKTL1 reaction. The estimated TKTL1 flux was 33±4, indicating that a significant portion of glucose was metabolized by this pathway. Only a small fraction of R5P and X5P was recycled back to F6P via noxPPP.
Figure 6.
Estimated metabolic fluxes for CHO cells at stationary phase (best fit ± stdev). Fluxes were normalized to the glucose uptake rate of 100. Fluxes were determined using 13C-MFA by simultaneously fitting GC-MS measurements from three parallel labeling experiments to a single flux model.
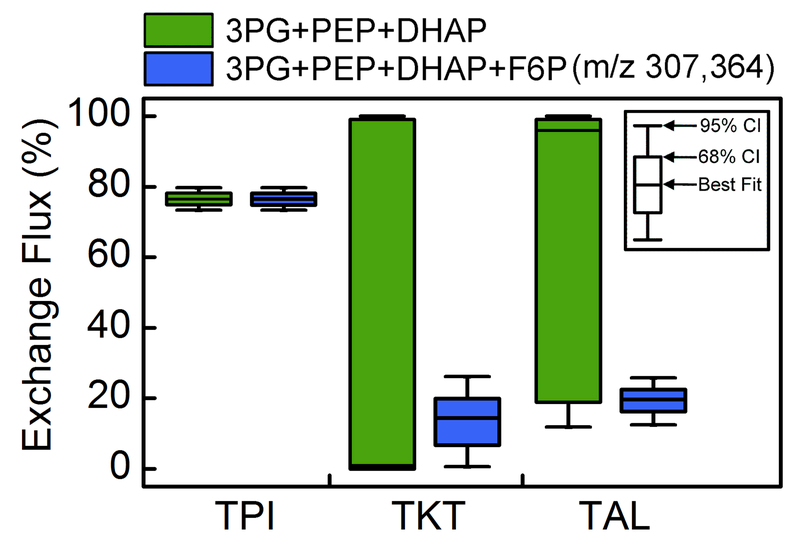
The addition of F6P labeling data not only improved the resolution of the TKTL1 flux, but also allowed good estimation of exchange fluxes in PPP. These exchange fluxes are notoriously difficult to estimate using traditional measurements (Crown et al., 2015). As shown in Figure 7, the transketolase (TKT) and transaldolase (TAL) exchange fluxes were unobservable when using only 3PG, PEP and DHAP data, but with the addition of F6P measurements the exchange fluxes were estimated with narrow confidence intervals.
Figure 7.
Addition of fructose 6-phosphate (F6P) labeling data improves estimation of exchange fluxes in PPP by 13C-MFA. The 68% and 95% flux confidence intervals are shown for triose phosphate isomerase (v5; TPI), transketolase (v13; TKT), and transaldolase (v15; TAL).
4. DISCUSSION AND CONCLUSIONS
In this work, we provide the first experimental evidence for TKTL1 flux in mammalian cells using isotopic tracers and 13C-MFA. To validate the proposed model and estimate metabolic fluxes new GC-MS measurements (i.e. F6P) and a set of three parallel labeling experiments were introduced, which allowed intuitive interpretation of mass isotopomer data to determine key fluxes in the model, including the TKTL1 flux. Using these new approaches, a high TKTL1 flux was detected in CHO cells at the stationary phase. Previously, our group and others have determined that CHO cells upregulate oxPPP flux at the stationary phase (Ahn and Antoniewicz, 2011; Ahn and Antoniewicz, 2013; Goudar et al., 2010; Sengupta et al., 2011; Templeton et al., 2013), which was surprising given that at the stationary phase the requirements for biosynthetic NADPH and R5P are significantly reduced. The flux results in this study suggest that a key function of oxPPP in CHO cells at the stationary phase is to fuel the TKTL1 reaction, i.e. in addition to producing NADPH e.g. to prevent oxidative stress during non-growth phase. One important unanswered question is still: what is the ultimate fate of the two carbon atoms that are released by the TKTL1 reaction. One hypothesis is that the cytosolic acetyl-CoA produced could be used for fatty acid biosynthesis (Coy et al., 2005). Indeed, in our previous study we measured a surprisingly high rate of fatty acid synthesis at the stationary phase in CHO cells (Ahn and Antoniewicz, 2013), consistent with this hypothesis. In future work, we plan to further investigate this hypothesis. If proven correct, this may provide a new link between glucose metabolism and lipogenesis in mammalian cells.
Supplementary Material
ACKNOWLEDGEMENTS
This work was supported by the NSF CAREER Award (CBET-1054120).
REFERENCES
- Ahn WS, Antoniewicz MR, 2011. Metabolic flux analysis of CHO cells at growth and non-growth phases using isotopic tracers and mass spectrometry. Metab Eng. 13, 598–609. [DOI] [PubMed] [Google Scholar]
- Ahn WS, Antoniewicz MR, 2013. Parallel labeling experiments with [1,2-(13)C]glucose and [U-(13)C]glutamine provide new insights into CHO cell metabolism. Metab Eng. 15, 34–47. [DOI] [PubMed] [Google Scholar]
- Antoniewicz MR, 2013. 13C metabolic flux analysis: optimal design of isotopic labeling experiments. Curr Opin Biotechnol. 24, 1116–21. [DOI] [PubMed] [Google Scholar]
- Antoniewicz MR, 2015a. Methods and advances in metabolic flux analysis: a mini-review. J Ind Microbiol Biotechnol. 42, 317–25. [DOI] [PubMed] [Google Scholar]
- Antoniewicz MR, 2015b. Parallel labeling experiments for pathway elucidation and 13C metabolic flux analysis. Curr Opin Biotechnol. 36, 91–97. [DOI] [PubMed] [Google Scholar]
- Antoniewicz MR, Kelleher JK, Stephanopoulos G, 2006. Determination of confidence intervals of metabolic fluxes estimated from stable isotope measurements. Metab Eng. 8, 324–37. [DOI] [PubMed] [Google Scholar]
- Antoniewicz MR, Kelleher JK, Stephanopoulos G, 2007a. Accurate assessment of amino acid mass isotopomer distributions for metabolic flux analysis. Analytical Chemistry. 79, 7554–7559. [DOI] [PubMed] [Google Scholar]
- Antoniewicz MR, Kelleher JK, Stephanopoulos G, 2007b. Elementary metabolite units (EMU): A novel framework for modeling isotopic distributions. Metabolic Engineering. 9, 68–86. [DOI] [PMC free article] [PubMed] [Google Scholar]
- Antoniewicz MR, Kelleher JK, Stephanopoulos G, 2011. Measuring deuterium enrichment of glucose hydrogen atoms by gas chromatography/mass spectrometry. Analytical Chemistry. 83, 3211–3216. [DOI] [PMC free article] [PubMed] [Google Scholar]
- Coy JF, Dressler D, Wilde J, Schubert P, 2005. Mutations in the transketolase-like gene TKTL1: clinical implications for neurodegenerative diseases, diabetes and cancer. Clinical laboratory. 51, 257–73. [PubMed] [Google Scholar]
- Coy JF, Dubel S, Kioschis P, Thomas K, Micklem G, Delius H, Poustka A, 1996. Molecular cloning of tissue-specific transcripts of a transketolase-related gene: implications for the evolution of new vertebrate genes. Genomics. 32, 309–16. [DOI] [PubMed] [Google Scholar]
- Crown SB, Ahn WS, Antoniewicz MR, 2012. Rational design of (1)(3)C-labeling experiments for metabolic flux analysis in mammalian cells. BMC Syst Biol. 6, 43. [DOI] [PMC free article] [PubMed] [Google Scholar]
- Crown SB, Antoniewicz MR, 2012. Selection of tracers for 13C-metabolic flux analysis using elementary metabolite units (EMU) basis vector methodology. Metab Eng. 14, 150–61. [DOI] [PMC free article] [PubMed] [Google Scholar]
- Crown SB, Antoniewicz MR, 2013. Parallel labeling experiments and metabolic flux analysis: Past, present and future methodologies. Metab Eng. 16, 21–32. [DOI] [PMC free article] [PubMed] [Google Scholar]
- Crown SB, Long CP, Antoniewicz MR, 2015. Integrated 13C-metabolic flux analysis of 14 parallel labeling experiments in Escherichia coli. Metab Eng. 28, 151–8. [DOI] [PMC free article] [PubMed] [Google Scholar]
- Fernandez CA, Des Rosiers C, Previs SF, David F, Brunengraber H, 1996. Correction of 13C mass isotopomer distributions for natural stable isotope abundance. Journal of Mass Spectrometry: JMS. 31, 255–262. [DOI] [PubMed] [Google Scholar]
- Goudar C, Biener R, Boisart C, Heidemann R, Piret J, de Graaf A, Konstantinov K, 2010. Metabolic flux analysis of CHO cells in perfusion culture by metabolite balancing and 2D [13C, 1H] COSY NMR spectroscopy. Metab Eng. 12, 138–49. [DOI] [PubMed] [Google Scholar]
- Grimm M, Munz A, Teriete P, Nadtotschi T, Reinert S, 2014. GLUT-1(+)/TKTL1(+) coexpression predicts poor outcome in oral squamous cell carcinoma. Oral surgery, oral medicine, oral pathology and oral radiology. 117, 743–53. [DOI] [PubMed] [Google Scholar]
- Hu LH, Yang JH, Zhang DT, Zhang S, Wang L, Cai PC, Zheng JF, Huang JS, 2007. The TKTL1 gene influences total transketolase activity and cell proliferation in human colon cancer LoVo cells. Anticancer Drugs. 18, 427–33. [DOI] [PubMed] [Google Scholar]
- Kayser G, Sienel W, Kubitz B, Mattern D, Stickeler E, Passlick B, Werner M, Zur Hausen A, 2011. Poor outcome in primary non-small cell lung cancers is predicted by transketolase TKTL1 expression. Pathology. 43, 719–24. [DOI] [PubMed] [Google Scholar]
- Keller MA, Turchyn AV, Ralser M, 2014. Non-enzymatic glycolysis and pentose phosphate pathway-like reactions in a plausible Archean ocean. Mol Syst Biol. 10, 725. [DOI] [PMC free article] [PubMed] [Google Scholar]
- Krockenberger M, Honig A, Rieger L, Coy JF, Sutterlin M, Kapp M, Horn E, Dietl J, Kammerer U, 2007. Transketolase-like 1 expression correlates with subtypes of ovarian cancer and the presence of distant metastases. International journal of gynecological cancer : official journal of the International Gynecological Cancer Society. 17, 101–6. [DOI] [PubMed] [Google Scholar]
- Langbein S, Frederiks WM, zur Hausen A, Popa J, Lehmann J, Weiss C, Alken P, Coy JF, 2008. Metastasis is promoted by a bioenergetic switch: new targets for progressive renal cell cancer. Int J Cancer. 122, 2422–8. [DOI] [PubMed] [Google Scholar]
- Langbein S, Zerilli M, Zur Hausen A, Staiger W, Rensch-Boschert K, Lukan N, Popa J, Ternullo MP, Steidler A, Weiss C, Grobholz R, Willeke F, Alken P, Stassi G, Schubert P, Coy JF, 2006. Expression of transketolase TKTL1 predicts colon and urothelial cancer patient survival: Warburg effect reinterpreted. Br J Cancer. 94, 578–85. [DOI] [PMC free article] [PubMed] [Google Scholar]
- Leighty RW, Antoniewicz MR, 2013. COMPLETE-MFA: complementary parallel labeling experiments technique for metabolic flux analysis. Metab Eng. 20, 49–55. [DOI] [PubMed] [Google Scholar]
- Liu L, Zhang L, Tang W, Gu Y, Hua Q, Yang S, Jiang W, Yang C, 2012. Phosphoketolase pathway for xylose catabolism in Clostridium acetobutylicum revealed by 13C metabolic flux analysis. J Bacteriol. 194, 5413–22. [DOI] [PMC free article] [PubMed] [Google Scholar]
- Meshalkina LE, Drutsa VL, Koroleva ON, Solovjeva ON, Kochetov GA, 2013. Is transketolase-like protein, TKTL1, transketolase? Biochim Biophys Acta. 1832, 387–90. [DOI] [PubMed] [Google Scholar]
- Nakahigashi K, Toya Y, Ishii N, Soga T, Hasegawa M, Watanabe H, Takai Y, Honma M, Mori H, Tomita M, 2009. Systematic phenome analysis of Escherichia coli multiple-knockout mutants reveals hidden reactions in central carbon metabolism. Mol Syst Biol. 5, 306. [DOI] [PMC free article] [PubMed] [Google Scholar]
- Sengupta N, Rose ST, Morgan JA, 2011. Metabolic flux analysis of CHO cell metabolism in the late non-growth phase. Biotechnol Bioeng. 108, 82–92. [DOI] [PubMed] [Google Scholar]
- Shi Z, Tang Y, Li K, Fan Q, 2015. TKTL1 expression and its downregulation is implicated in cell proliferation inhibition and cell cycle arrest in esophageal squamous cell carcinoma. Tumour biology : the journal of the International Society for Oncodevelopmental Biology and Medicine. 36, 8519–29. [DOI] [PubMed] [Google Scholar]
- Song Y, Liu D, He G, 2015. TKTL1 and p63 are biomarkers for the poor prognosis of gastric cancer patients. Cancer biomarkers : section A of Disease markers. 15, 591–7. [DOI] [PubMed] [Google Scholar]
- Templeton N, Dean J, Reddy P, Young JD, 2013. Peak antibody production is associated with increased oxidative metabolism in an industrially relevant fed-batch CHO cell culture. Biotechnol Bioeng. 110, 2013–24. [DOI] [PubMed] [Google Scholar]
- Volker HU, Scheich M, Schmausser B, Kammerer U, Eck M, 2007. Overexpression of transketolase TKTL1 is associated with shorter survival in laryngeal squamous cell carcinomas. European archives of oto-rhino-laryngology : official journal of the European Federation of Oto-Rhino-Laryngological Societies. 264, 1431–6. [DOI] [PubMed] [Google Scholar]
- White RH, 2004. L-Aspartate semialdehyde and a 6-deoxy-5-ketohexose 1-phosphate are the precursors to the aromatic amino acids in Methanocaldococcus jannaschii. Biochemistry. 43, 7618–27. [DOI] [PubMed] [Google Scholar]
- Xiong W, Lee TC, Rommelfanger S, Gjersing E, Cano M, Maness PC, Ghirardi M, Yu J, 2016. Phosphoketolase pathway contributes to carbon metabolism in cyanobacteria. Nature Plants. doi: 10.1038/nplants.2015.187. [DOI] [PubMed] [Google Scholar]
- Xu X, Zur Hausen A, Coy JF, Lochelt M, 2009. Transketolase-like protein 1 (TKTL1) is required for rapid cell growth and full viability of human tumor cells. Int J Cancer. 124, 1330–7. [DOI] [PubMed] [Google Scholar]
- Yoo H, Antoniewicz MR, Stephanopoulos G, Kelleher JK, 2008. Quantifying reductive carboxylation flux of glutamine to lipid in a brown adipocyte cell line. Journal of Biological Chemistry. 283, 20621–20627. [DOI] [PMC free article] [PubMed] [Google Scholar]
- Young JD, Walther JL, Antoniewicz MR, Yoo H, Stephanopoulos G, 2008. An Elementary Metabolite Unit (EMU) based method of isotopically nonstationary flux analysis. Biotechnology and Bioengineering. 99, 686–699. [DOI] [PubMed] [Google Scholar]
Associated Data
This section collects any data citations, data availability statements, or supplementary materials included in this article.


