Figure 2.

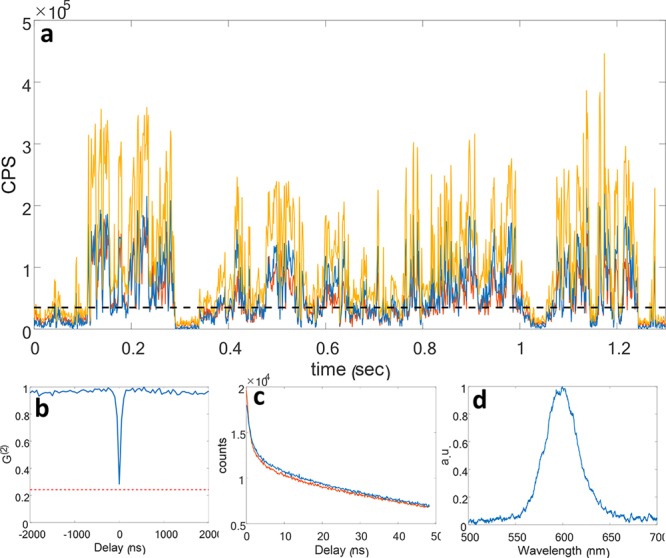
(a) Example of a blinking trace (bin size 1 ms) of a single NR when detected by the setup depicted in Figure 1e. The intensities recorded in the reflection (blue) and transmission (red) channels are almost identical, showing a 50:50 split of the emission peak by the dichroic. The sum of the signal from both channels (yellow) presents detection rates of up to 400 kHz. The threshold chosen for this measurement is shown with a black dashed line. (b) Photon detection coincidences as a function of delay between the two channels. A dip is evident at zero delay, where the correlation drops to 6% after correcting for the background, indicating that the fluorescence is collected from a single emitter. An estimated background level is plotted as a dashed red line. (c) Fluorescence decay in counts per second (CPS) as a function of time in the reflection (blue) and transmission (red) channels. (d) Example spectrum from a single NR (30 s exposure).
