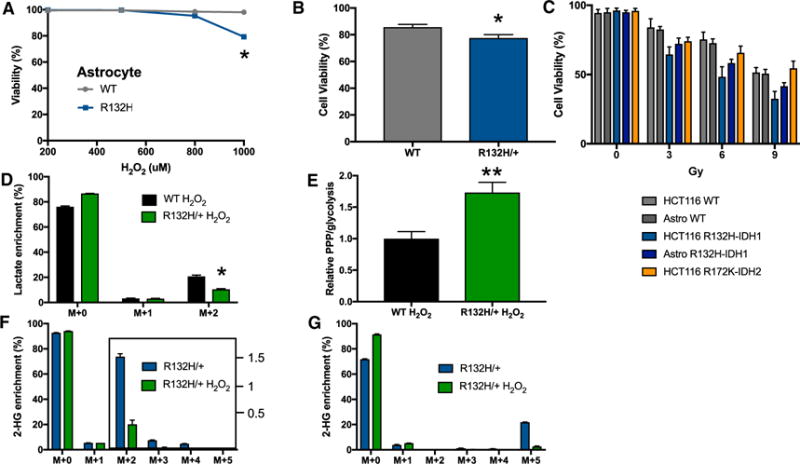
Figure 6. Effects of Oxidative Stress on IDH1 and IDH2 Mutant Cells.

(A) Cell viability as measured by release of LDH from wild-type or IDH1 mutant astrocytes after H2O2 treatment for 3 hr at the concentrations shown.
(B) Cell viability as measured by release of LDH from wild-type or R132H/+ HCT116 cells after 1 mM H2O2 treatment for 3 hr.
(C) Percent cell viability after 0–9 Gy of IR treatment. Cell viability was measured 72 hr after exposure in HCT116 cells and 96 hr after exposure in astrocytes (astrocytes did not exhibit signs of cell death at 72 hr).
(D) Isotopologue distribution of lactate after HCT116 R132H/+ cells were incubated in 1,2-13C2 glucose and 1 mM H2O2 for 1 hr.
(E) The ratio of PPP to glycolysis is elevated in wild-type HCT116 cells relative to R132H/+ mutants after exposure to H2O2 for 1 hr.
(F) Isotopologue distribution of 2-HG after HCT116 R132/+ cells were incubated in U-13C glucose with or without 1 mM H2O2 for 3 hr.
(G) Isotopologue distribution of 2-HG after HCT116 R132H/+ cells were incubated in U-13C glutamine, with or without 1 mM H2O2 for 3 hr. Data shown are mean values ± SD (n = 3). *p value < 0.05; **p value < 0.01.
