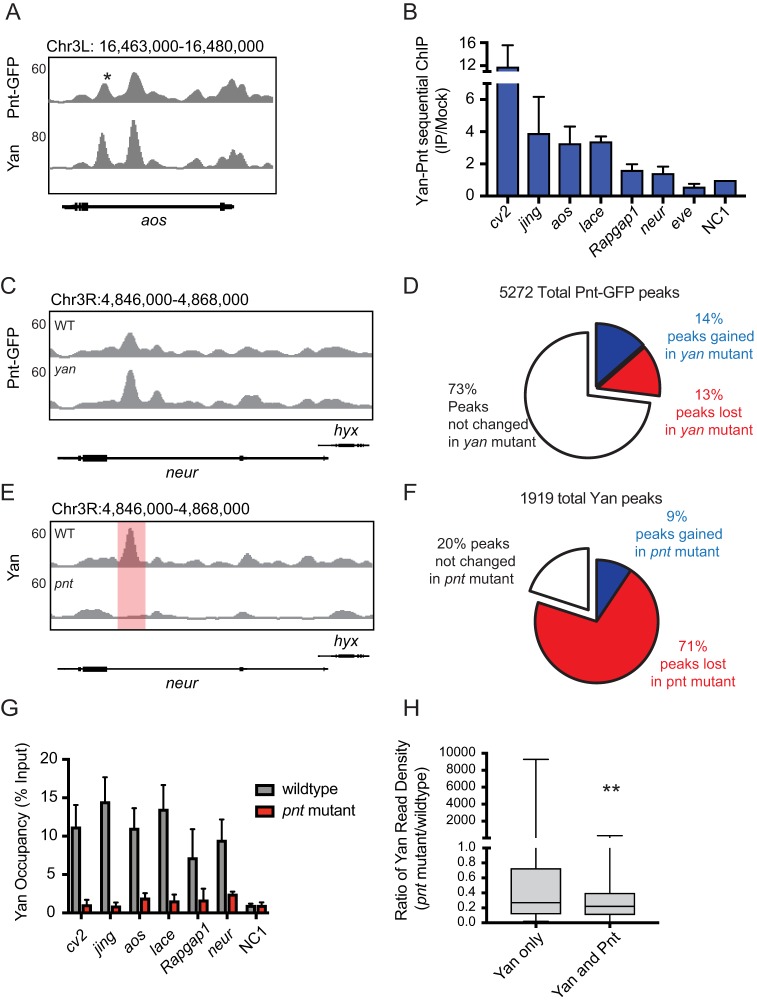
Fig. 1.
Pnt recruits Yan to chromatin. (A) Comparison of ChIP-seq read density for Pnt-GFP (Pnt) and Yan across argos (aos), with RefGene gene track shown below profiles. Asterisk marks the region assessed by ChIP-qPCR. (B) Sequential Yan-Pnt ChIP-qPCR analysis plotted as fold increase relative to mock-treated control, normalized to a negative control region (NC1; Webber et al., 2013a), using mean±s.e.m. from two (cv-2 and lace) or more separate experiments. (C,E) ChIP-seq read density profiles for Pnt-GFP and Yan from wild-type (WT) and yan or pnt mutant embryos at neur. Red shading highlights an example of statistically significant reduction in Yan occupancy. (D,F) Pie charts showing the proportion of Pnt or Yan peaks gained or lost in the reciprocal mutant background. (G) ChIP-qPCR analysis of Yan occupancy at candidate target regions from either control (wild-type) or pnt mutant embryos. Data from at least three separate experiments are plotted as mean±s.e.m. normalized to a negative control region. (H) Comparison of ratios of Yan read density in pnt mutants relative to the wild-type control. Yan-bound regions that do not intersect with a Pnt-bound peak were less affected by loss of pnt than peaks that intersect Pnt. **P<0.01 (Student's t-test).

