Fig. 4.
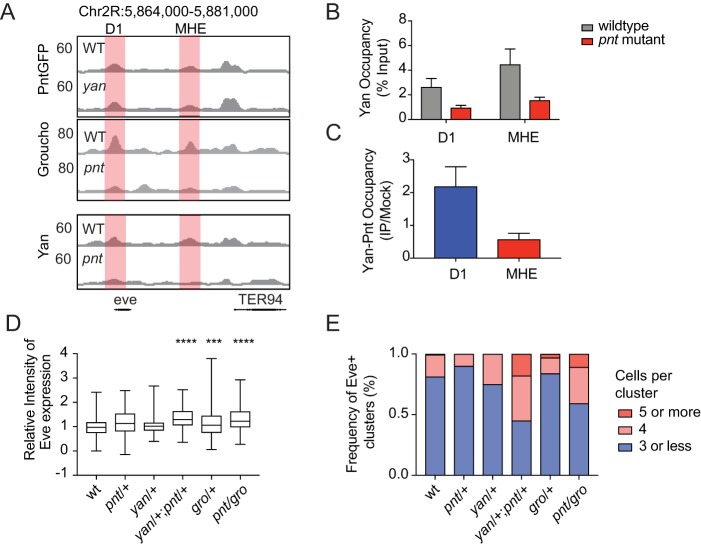
Yan, Pnt and Gro collaborate to fine-tune eve expression. (A) Read density profiles for Pnt-GFP, Gro and Yan from wild-type or mutant embryos at the eve locus. Red shading shows that Pnt-GFP occupancy is broadly maintained at the MHE and D1 in the absence of Yan, whereas Yan and Gro occupancy is reduced at both elements in the absence of Pnt. (B) ChIP-qPCR analysis of Yan occupancy at the D1 and MHE in stage 11 wild-type or pnt mutant embryos. Data from at least five separate experiments are plotted as mean±s.e.m. normalized to a negative control region. (C) Sequential ChIP detects Yan-Pnt co-occupancy at the D1 but not at the MHE. Fold increase relative to mock-treated control and normalized to a negative control region is plotted. Bars represent mean±s.e.m. of at least six independent experiments. (D) Quantification of average Eve levels per cluster in different genetic backgrounds. Box plots depict measurements from at least 70 clusters. ***P<0.001; ****P<0.0001 (ANOVA with Tukey's multiple comparison test). (E) Bar charts depicting the frequency of clusters with different numbers of Eve+ cells from at least seven embryos.

