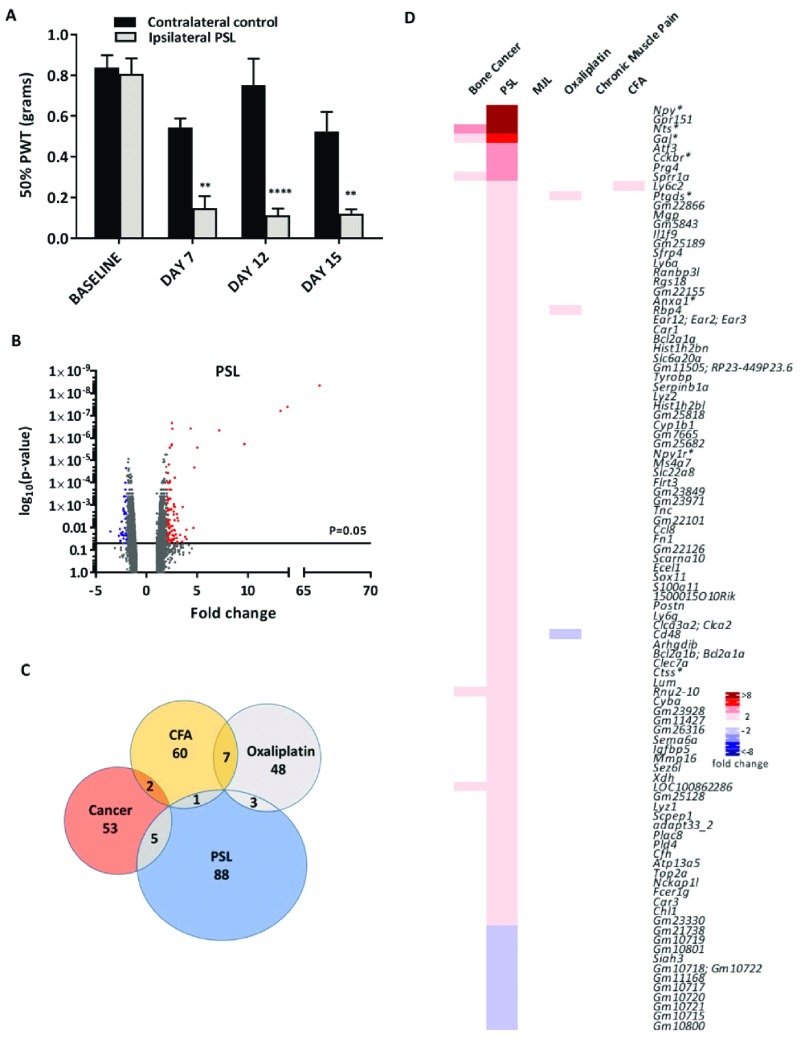
Figure 2. Differential gene expression in the partial sciatic nerve ligation (PSL) neuropathic pain model.
( A) Mechanical sensitivity using von Frey filaments on ipsilateral and contralateral paws following PSL surgery (n=4, **indicates p<0.01, ****indicates p<0.0001, 2-way ANOVA with posthoc Bonferonni test). PWT = paw withdrawal threshold. ( B) Volcano plot for all genes identified in the PSL pain model array. Each dot represents a single gene (red=upregulated; blue=downregulated). ( C) Venn diagram showing the number of differentially expressed DRG genes (fold change >2, <-2, p<0.05) shared with other pain models. ( D) Heat map of upregulated (red) and downregulated (blue) DRG genes (fold change >2, <-2, p<0.05) and a comparison of shared genes across models. Genes with an asterisk are present within the Pain Genes Database of pain-related transgenic knockout studies 34.

