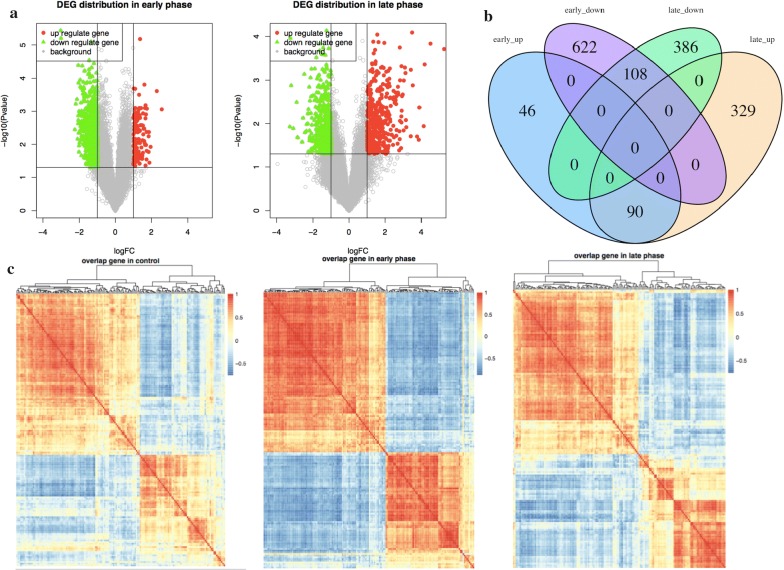
Fig. 1.
The distribution of differentially expressed genes in the early and late phase. a The horizontal axis is logFC, and the vertical axis is the P-value after the negative logarithm conversion. The left panel shows the distribution of early-phase lung cancer related genes, and the right panel shows the distribution of late-phase lung cancer related genes. Up- and down-regulated genes are marked in red and green, respectively. b Up/down-regulated genes in the early and late phases are marked with four colour markers. c Each colour block corresponds to the correlation coefficient of two genes: the red represents a positive correlation, and the blue represents a negative correlation. The heatmap matrix from left to right corresponds to the control and the early and late phases

