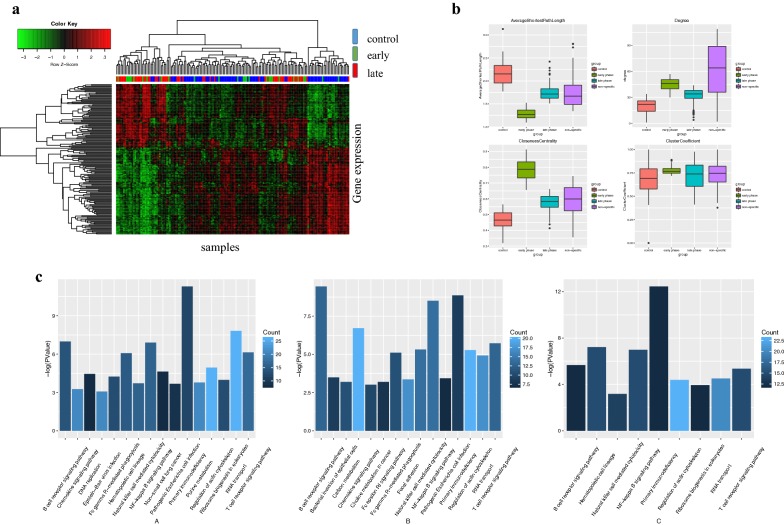
Fig. 2.
The expression and function property of the genes. a The horizontal axis represents the sample; the vertical axis represents the genes. We use three colours to mark the different levels of classification of lung adenocarcinoma: blue for the control group, green for the early phase, and red for the late phase. The red and green blocks represent the expression pattern of the gene; green represents low expression, and red represents high expression. b shows the analysis of four topological network properties, including the average shortest path, node degree distribution, closeness centrality, and clustering coefficient. Different groups are marked in different colours. c A–C corresponds to the pathway enrichment results of three phases. The horizontal axis is the pathway term, and the vertical axis is the P-value after the negative logarithmic transformation. We label the number of genes in the pathway by dark blue and light blue markers. The brighter the colour, the more genes that are enriched in the pathway; the darker the colour, the fewer genes that are enriched

