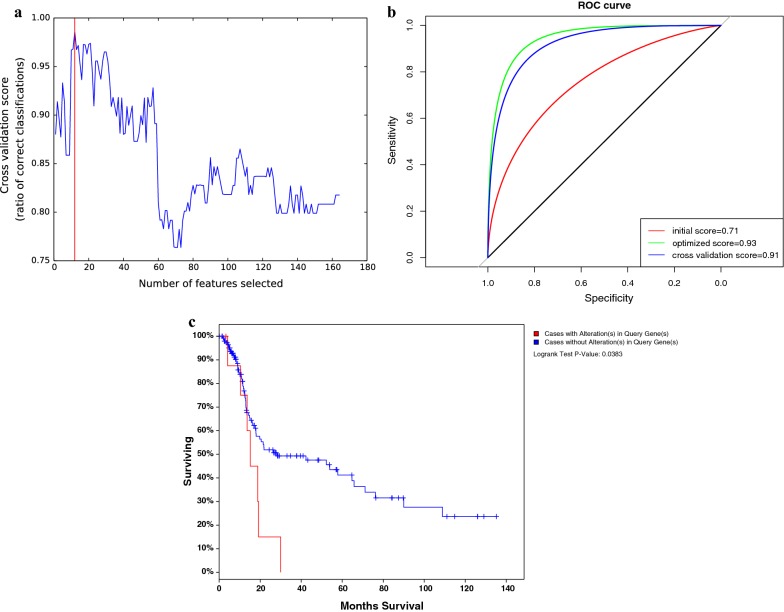
Fig. 6.
The performance of biomarkers. a The horizontal axis is the number of selected features. The vertical axis is the corresponding accuracy. b The red curve is the initial model accuracy without optimization. The green curve is the accuracy of the model after feature selection and parameter optimization. The blue curve is the average accuracy calculated using a fivefold cross-validation method. c The survival analysis. The horizontal axis is the survival time (month). The vertical axis is the percentage of patients in different groups

