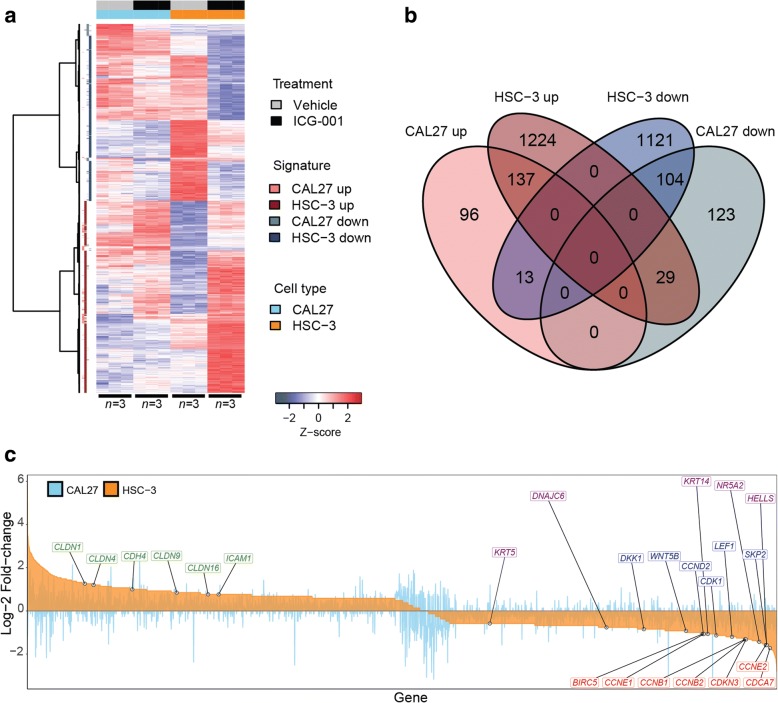
Fig. 2.
Genome-wide transcriptional profiling of non-metastatic and metastatic OSCC cells treated with ICG-001. a Heatmap of microarray gene expression treatment signatures derived from metastatic HSC-3 and non-metastatic CAL27 cells. RNA was extracted and profiled using microarrays from each cell line and gene expression profiles were compared by differential expression testing (ICG-001 treatment versus DMSO vehicle; n = 3 per treatment group, per cell line). Signatures were derived for each cell line by retaining genes with filtered-FDR q ≤ 0.01 and absolute linear fold-change ≥ 1.5. Row z scores of log2 expression values per gene are shown. b Metastatic HSC-3 cells display higher sensitivity to transcriptional dysregulation by ICG-001 treatment than less aggressive CAL27 cells. Venn diagram summarizing the size and overlap of treatment signatures in HSC-3 and CAL27 cells is shown. c ICG-001 impacts the expression of genes with roles in Wnt/β-catenin signaling (blue), cell proliferation and survival (red), intercellular adhesion (green), and stem cell-like behavior (purple). Waterfall plot displaying log2 fold-changes of gene expression for all genes included in either HSC-3 or CAL27 treatment signatures (n = 2847 genes) is shown

