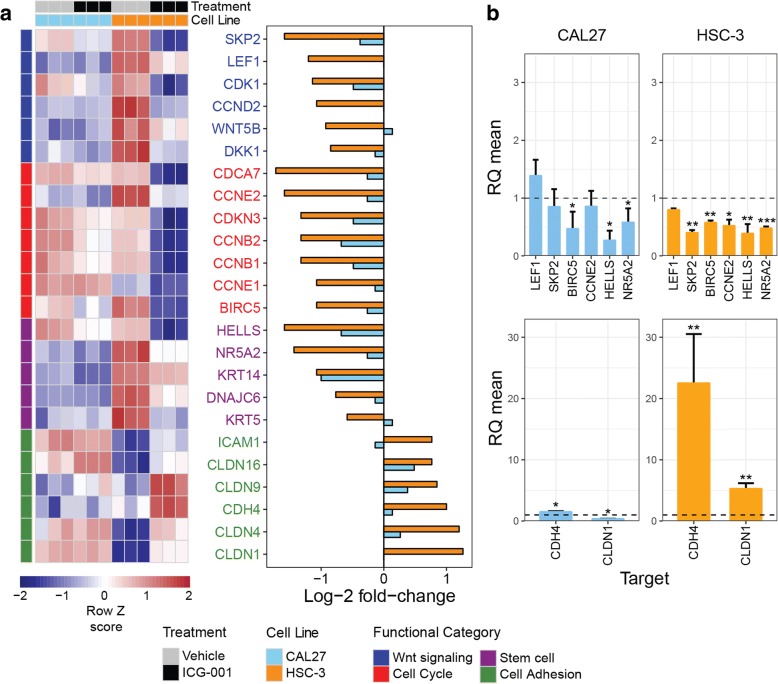
Fig. 3.
Differential expression profiles and validation of key genes affected by ICG-001 in OSCC cells. a Heatmap of microarray gene expression levels pertaining to genes highlighted in Fig. 2c, along with their log fold-change of expression upon ICG-001 treatment in HSC-3 and CAL27 cells. b qRT-PCR validation of microarray profiles for select target genes confirming changes in gene expression upon treatment with ICG-001. *P < 0.05; **P < 0.01; ***P < 0.001 unpaired t test

