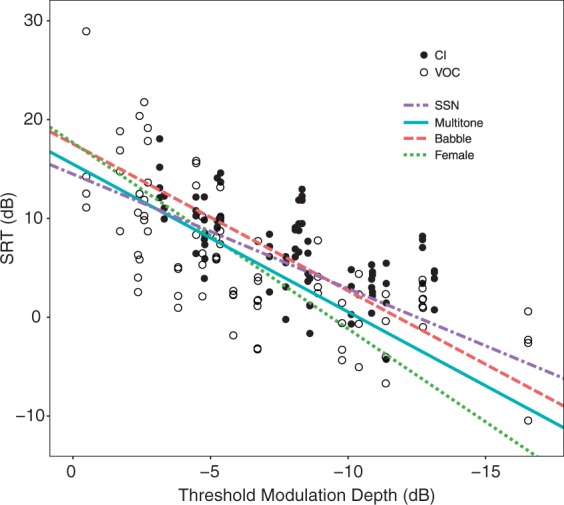
Figure 4.

Speech reception as a function of SMD threshold, with regression lines plotted for the four different maskers. Vocoder subjects are shown in open symbols, and CI subjects are shown in filled symbols. In the vocoder group, each subject has three points for the three different simulated current spread conditions.
CI = cochlear implant; SRT = speech reception threshold; SSN = speech-shaped noise; VOC = vocoder.
