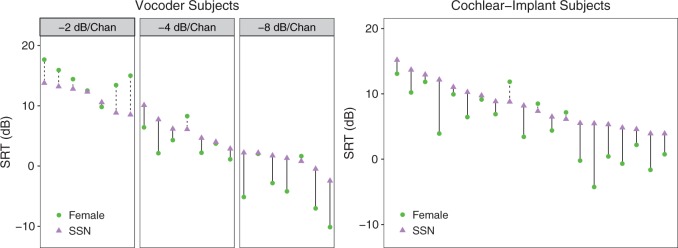
Figure 6.
MR for individual subjects. Data points show SRTs for the SSN and Female maskers and are rank-ordered according to each subject’s baseline SRT with the SSN masker. The length and style of the line connecting the SSN data point to the Female masker data point represents the degree of MR (solid lines) or negative MR (dashed lines). Results from the vocoder subjects are shown for each of the three simulated current spread conditions (left panel), whereas there is only a single SRT pair of data for each CI subject (right panel).
SRT = speech reception threshold; SSN = speech-shaped noise.

