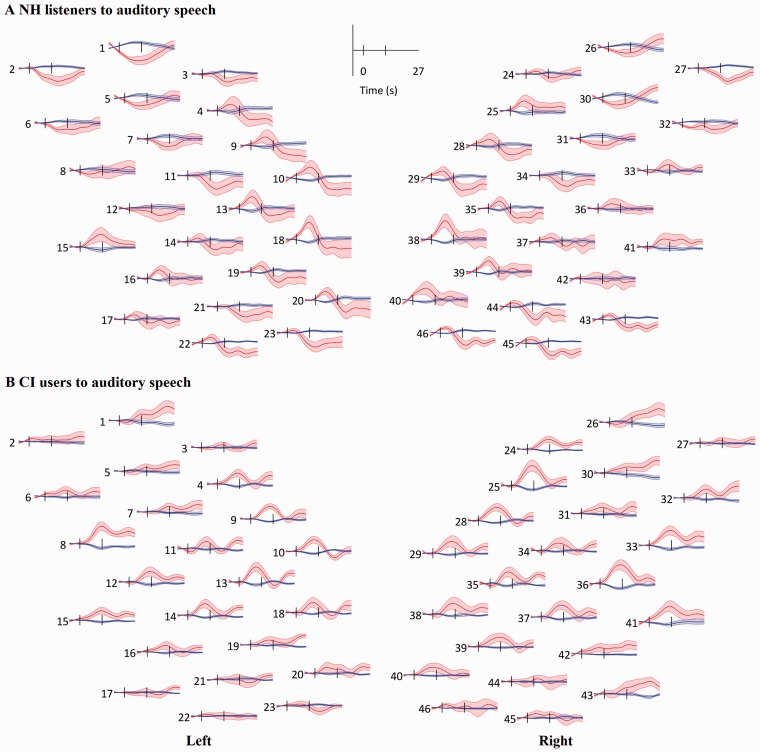
Figure 4.
Grand mean response to auditory speech in each channel. (a) Response in the NH group. (b) response in the CI group. Red lines and shaded areas: mean and SEM of HbO and blue for HbR. Black vertical lines mark the onset and offset of stimulation. The layout of the channels corresponds to the montage shown in Figure 1.

