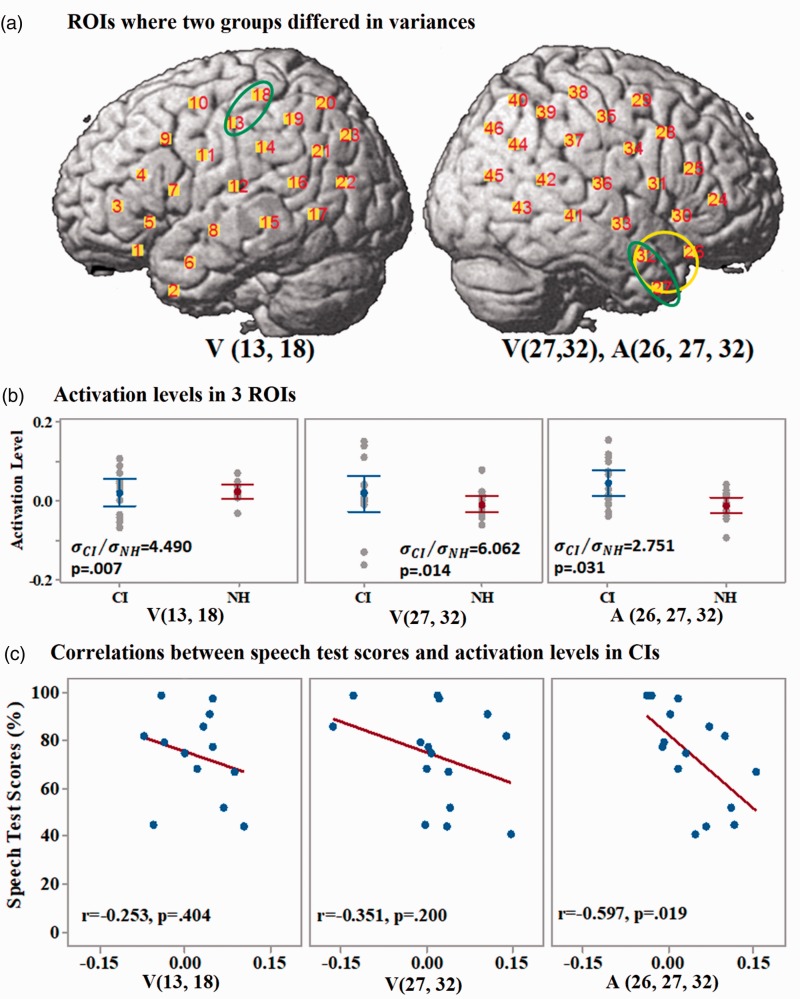
Figure 8.
Results of group variances differences-related ROIs. (a) ROIs where two groups differed in the variances of activation levels. Green and yellow ellipses mark the regions on the cortex that showed larger variances of activation levels in CI users than in NH listeners when responding to visual and auditory speech stimuli, respectively. (b) Comparisons of the activation levels in the three ROIs between CI users (in blue) and NH listeners (in red). Error bars are 95% confidence intervals. (c) Pearson correlations between the activations levels in the three ROIs of CI users and their speech test scores. Brain activation levels (concentration changes of HbO) are in the unit of µMol.

