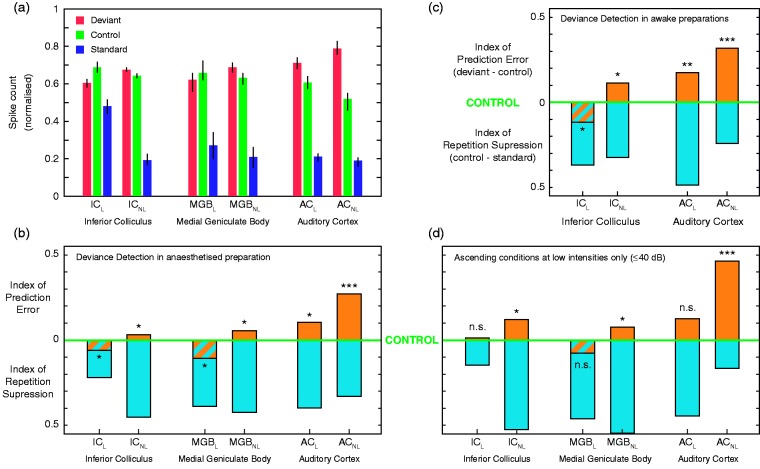
Figure 5.
Emergence of prediction error along the auditory hierarchy. (a) Median normalized tone-evoked responses (lines indicate SEM) to the deviant, standard, and control within each recorded auditory station. (b) Median indices of prediction error (orange) and repetition suppression (cyan) in anesthetized rats, represented with respect to the baseline set by the control. Thereby, the index of prediction error is upward-positive, while the index of repetition suppression is downward-positive. Each median index corresponds to differences between normalized responses in (a). Asterisks denote statistical significance of prediction error against zero median (*p = .05, **p = .01, ***p = .001). (c) Indices of prediction error and repetition suppression in awake mice. (d) Same as in (b), but only representing ascending conditions at low intensities.
AC = auditory cortex; MGB = medial geniculate body of the thalamus; IC = inferior colliculus; L = lemniscal divisions; NL = nonlemniscal divisions. Adapted from Parras et al. (2017).

