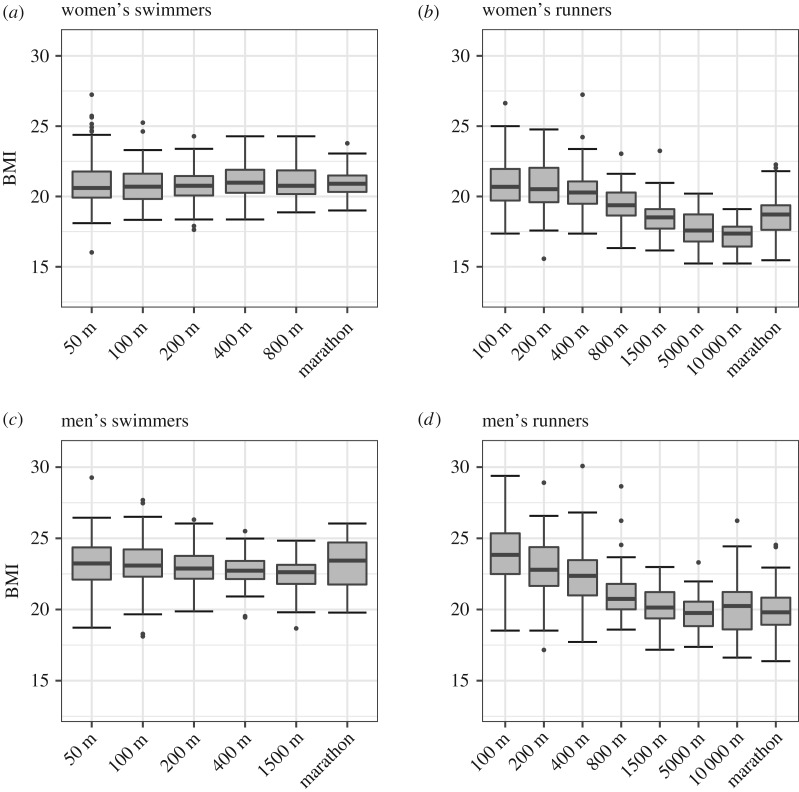
Figure 1.
Relationship between race distance and BMI in runners and swimmers in men's and women's events. Full model results in table 1. The boxplot centre line is the median. The lower and upper margins of the box are the first and third quartiles, respectively. The upper whisker is the third quartile plus 1.5 times the interquartile range. The lower whisker is the first quartile minus 1.5 times the interquartile range. Outliers appear as points.

