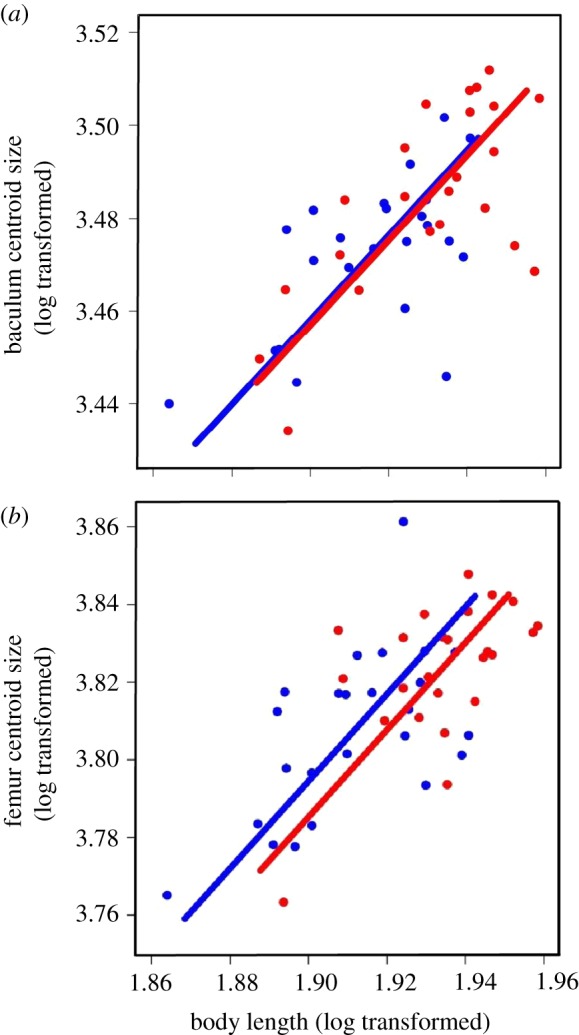
Figure 1.

Allometric scaling of baculum centroid size (a) and femur centroid size (b) in male house mice. Blue symbols (greyscale—black) represent the ‘No Risk’ social environment and red symbols (greyscale—grey) the ‘Risk’ social environment. One regression line is fitted per treatment based on standardized major axis regression. (Online version in colour.)
