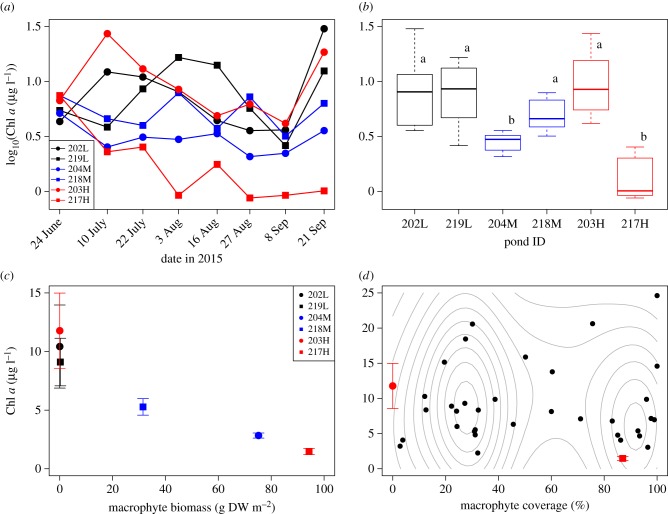
Figure 2.
Experimental and observational results. (a) Time-series and (b) boxplot of log-scaled chlorophyll a (Chl a) under three light intensities. The bold line in the box indicates the median value. Lower/upper limits of the box are the first/third quartiles, respectively. Lower/upper whisker plots represent the minimum/maximum values within the first/third quartiles minus/plus 1.5× interquartile range, respectively. The different characters on the box indicate significant differences among the ponds using a post-hoc multiple comparison for LMM (p < 0.002). (c) A correlation between chlorophyll a (mean and standard error, s.e.) and submersed macrophyte biomass (Spearman's ρ = –0.99; p = 0.00031). Red: control, blue: medium-light, black: low-light. Circle: road-side ponds, square: channel-side ponds. (d) Macrophyte coverage (%) and chlorophyll a concentration in 34 non-shaded ponds in 2016 (we removed a pond with an outlier value of chlorophyll a, see text). Black points indicate mean values at two sampling times in 2016. Red points and error bars indicate mean and s.e. values of non-shaded control ponds in 2015. Grey contours indicate a two-dimensional binned kernel density estimation.

