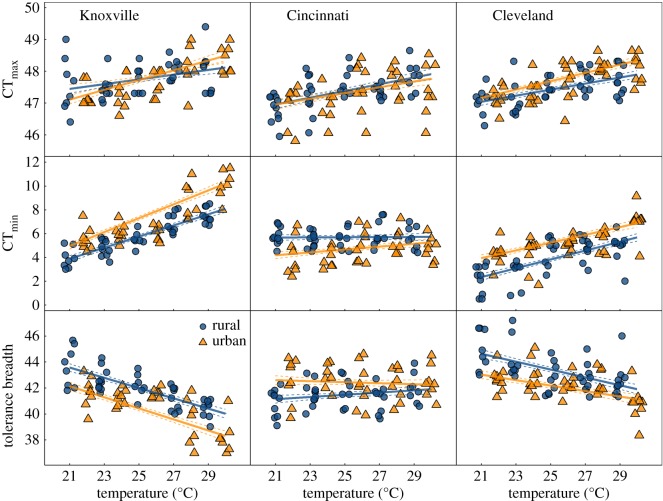
Figure 1.
Thermal tolerance responses (CTmax, CTmin and tolerance breadth) of urban and rural acorn ant workers to rearing temperature. Responses from three cities are shown in separate panels. Lines represent predicted values ±1 s.e. from linear mixed effects models (performed separately for each city). See table 1 for model coefficients. Points indicate colony mean thermal tolerance, and are jittered within each combination of source population and temperature treatment.

