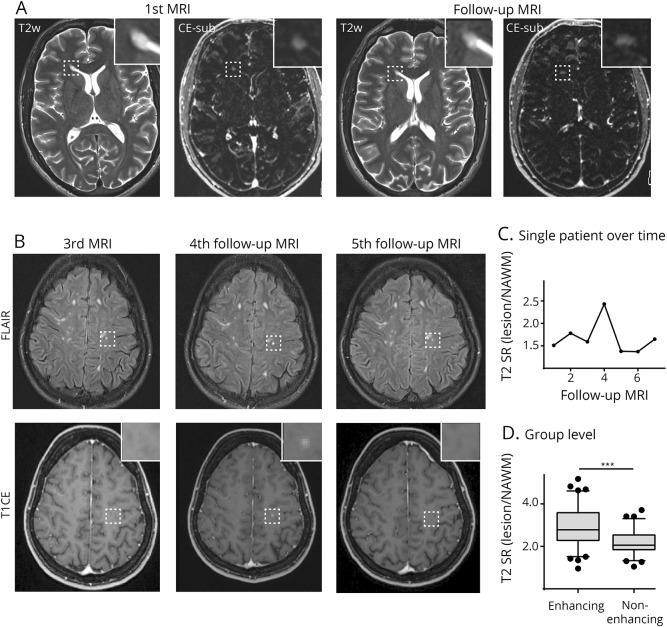
Figure 2. T2-weighted and subtraction images.
T2-weighted and subtraction images (CE T1—T1 before gadolinium (Gd) administration) of a patient with persistent contrast enhancement of a periventricular lesion at the right frontal horn (box and magnified image) (A). First and follow-up MRI in A are 11 months apart. Example of a patient with a lesion in the left precentral gyrus (box and magnified image) that shows contrast enhancement of a preexisting lesion (“lesion reactivation”) on the 4th follow-up scan (B). This goes along with an increased T2 signal ratio (C). T2 signal ratio of enhancing and nonenhancing lesions (D); N = 78 lesions. Whiskers indicate 5th and 95th percentiles. The box is 25th and 75th percentiles. CE-sub = contrast-enhanced subtraction post-pre Gd-T1 MRI; FLAIR = fluid-attenuated inversion recovery; NAWM = normal-appearing white matter; SR = signal ratio.

