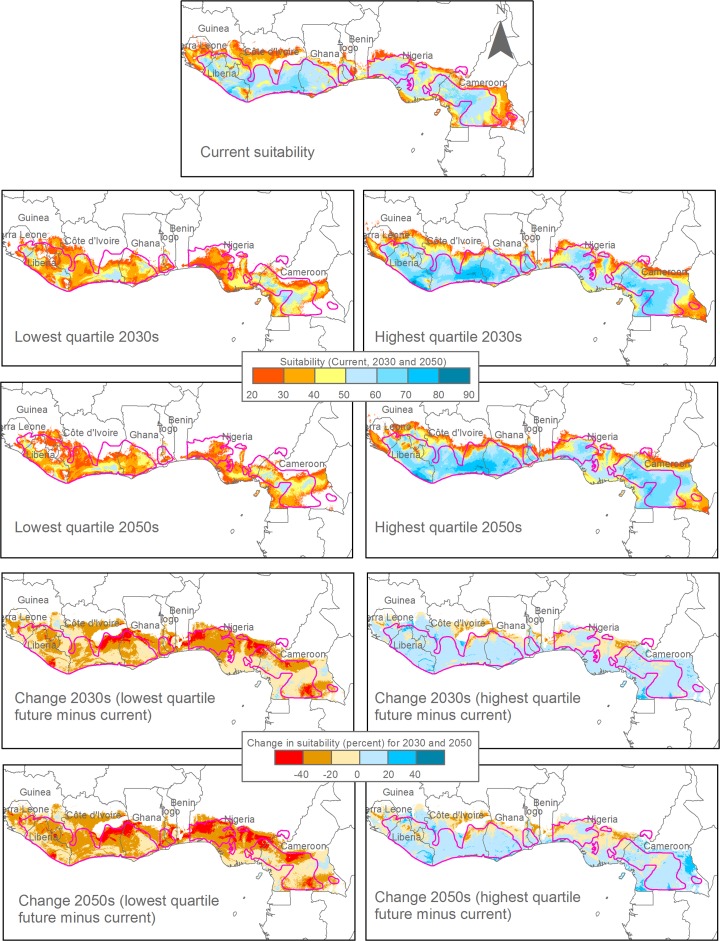
Fig. 2.
First and third quartile of relative climatic suitability projections (in percent) for cocoa (Theobroma cacao) of 15 (2030s) and 19 (2050s) global circulation models as modeled with Maxent for the West African cocoa belt, indicative of pessimistic (1st quartile) and optimistic (3rd quartile) climate change scenarios, and corresponding suitability changes relative to the current climate. The red lines delimit current cocoa production areas. The Maxent model of relative climatic suitability is the same as in Fig. 1

