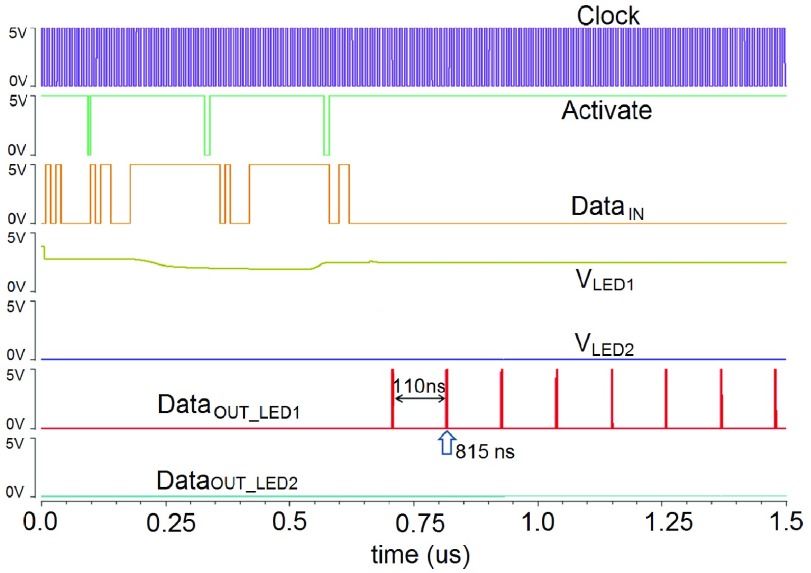
Fig. 9.
Top-level simulation results for the diagnostic sensing circuitry. A random LED  is chosen for analysis, and
  is selected for comparison. During this simulation,
  is set as 3.75 V (e.g. —
 — is equal to 1.25 V), the diagnostic voltage is equal to 2.40 V, and the
  is correspondingly equal to 110 ns. The local circuit schematic is referred to Figure 6(b).

