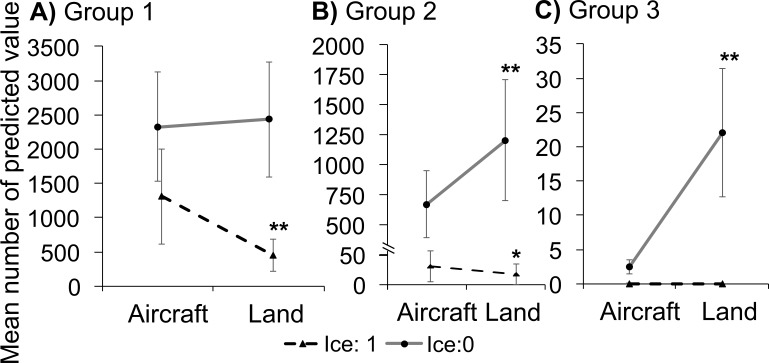
Figure 2. Predicted values of the fitted generalized mixed model.
This shows differences between the results of waterbird counts during the non-breeding period in the Odra River Estuary carried out with two research platforms, i.e., from the ground and from the air in relation to different species groups. (A, B, C) show different groups of target species according to different ice conditions and count methods; whiskers indicate standard errors; the asterisk shows a statistically significant difference between Aircraft and Land counts performed as post-hoc tests adjusted by the Tukey method; **, p < 0.001; *, p < 0.06.

