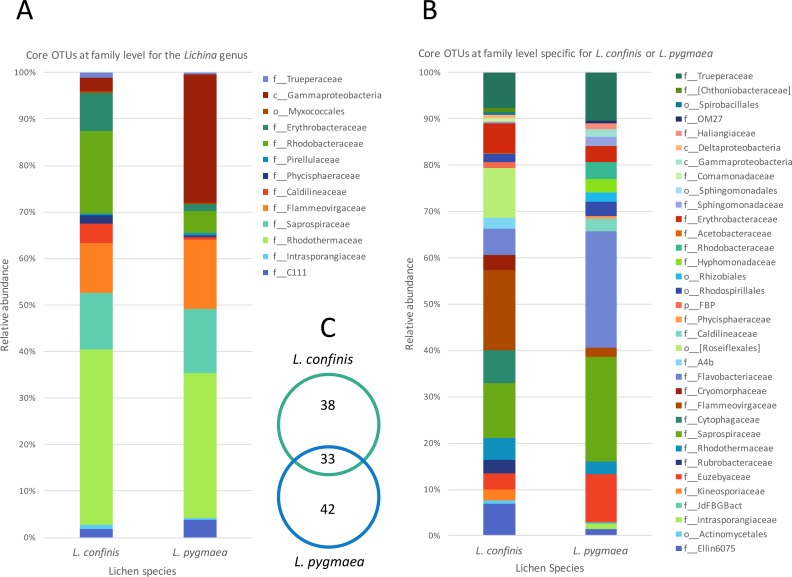
Figure 5. Comparison of relative abundance of core or specific OTUs present in L. confinis and L. pygmaea.
Comparison of relative abundance of core OTUs present in (A) all replicates of both L. confinis and L. pygmaea or (B) the core OTUs specific for either species grouped at the family level. When family level assignment was not available, the next higher taxonomic level assigned was used. (C) Venn diagram showing the number of core OTUs shared or specific to L. confinis and L. pygmaea.

