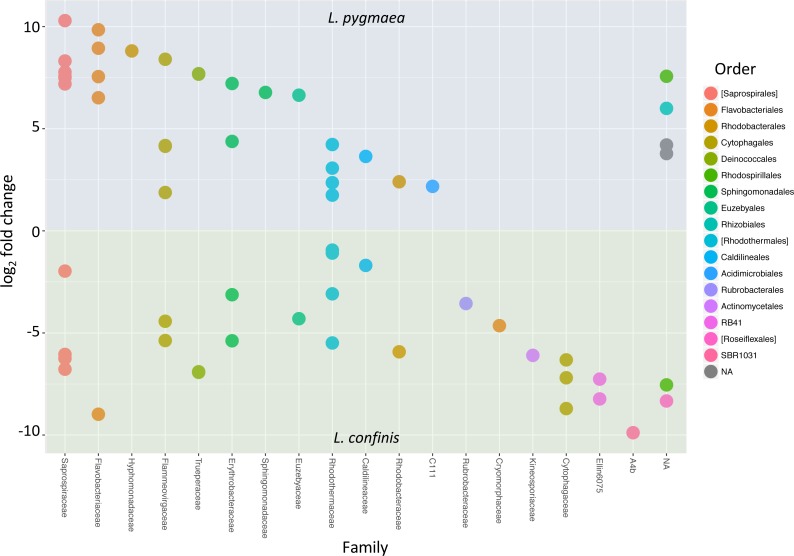
Figure 6. OTUs with significantly different relative abundances in L.confinis and L. pygmaea.
OTUs with significantly different relative abundances in L.confinis and L. pygmaea were assessed by the DESeq2 package using an adjusted p value < 0.001 and a base mean threshold > 20. NA : OTUs not assignable at the particular taxonomic level (order or family).

