
Figure 1. Identification of genes involved in biotic and abiotic stresses.
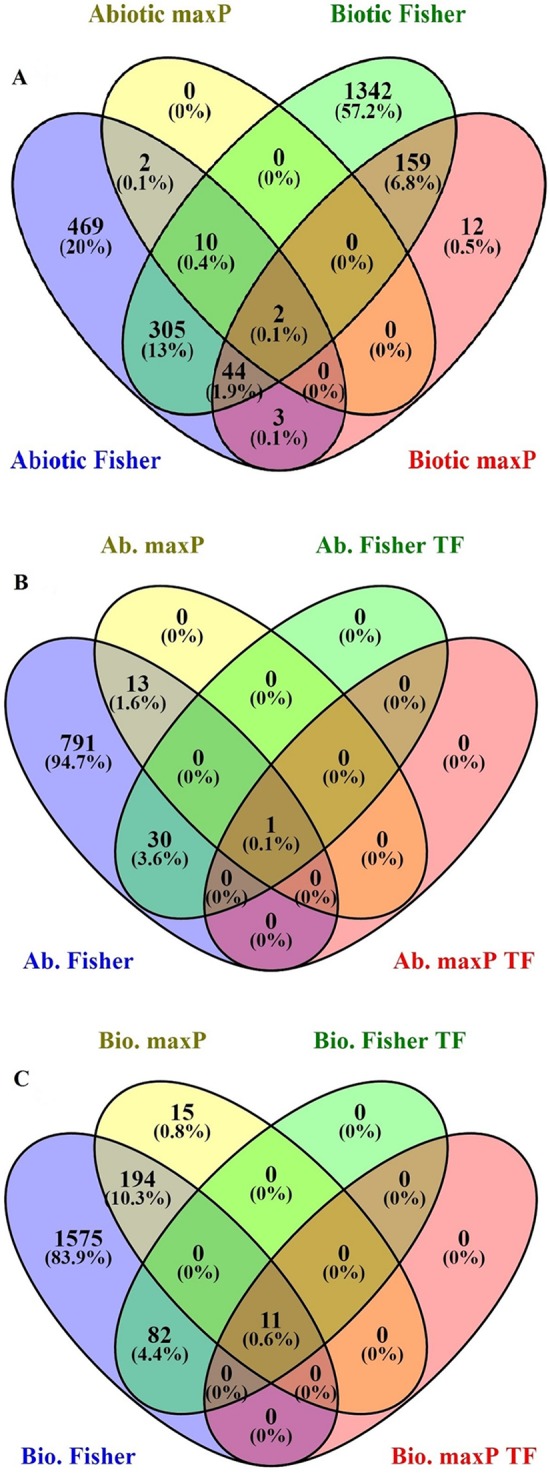
Comparison of differentially expressed genes (DEGs) under abiotic and biotic stress responses. (A) Four-way Venn diagrams showing co-occurrence of DEGs in response to various abiotic and biotic stresses by two meta-analytical approaches: Fisher and maxP methods. (B) Four-way Venn diagrams showing number of transcription factors DEGs in all identified abiotic stresses by two different meta-analytical statistical methods: Fisher and maxP. (C) Four-way Venn diagrams showing number of transcription factors DEGs in all identified biotic stresses by two different meta-analytical statistical methods: Fisher and maxP.