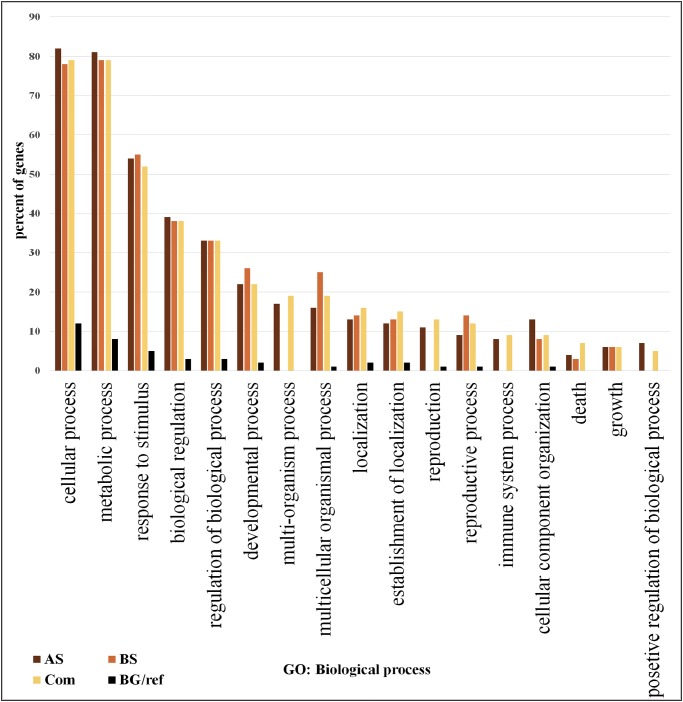
Figure 2. Gene ontology analysis.
Frequency of most representative biological process terms. Com: Differentially expressed genes obtained by common genes in biotic and abiotic stresses, AS: Differentially expressed genes obtained by abiotic stresses, BS: Differentially expressed genes obtained by biotic stresses. BG: The frequency of these terms in the reference genes, Tomato Locus set. Gene Ontology analysis made in the AgriGO platform (FDR = 5%). More details in Tables S10 and S11.

